Strait Intelligence · Strait Signal
End of Week Charts
A rougher tape than the 1 August read across most of the sector. Momentum broke down cleanly for three names that had been sitting at a clean 80/Green — Nordic American, Tsakos, and TORM all slipped to 45/Orange as MACD crossed below signal and ROC turned flat-to-negative, even with trend structure fully intact on all three. International Seaways cracked further to 50/Orange on its own fresh bearish crossover, with volatility now the bigger concern heading into Monday’s Q2 report. Okeanis eased from Green to 70/Yellow purely on a volatility spike tied to today’s post-earnings pullback — trend and momentum there are actually the strongest in the batch. Scorpio extended its decline for a second straight week, now the weakest read at 30/Red after slipping back below its own 50-day average. The steadiest four — DHT, Frontline, Teekay Corporation, and Teekay Tankers — all held their 80/Green scores unchanged, and not a single tanker name in the coverage list shows real ADX trend-strength conviction underneath any of it. On the macro side, Gold posts a rare perfect 100/100 as its trend genuinely turns higher, the 10-Year Treasury eases off last week's perfect score but stays Green, and the Dollar Index improves from Red to Orange as its downtrend picks up real ADX conviction — a combination worth watching alongside the tanker-equity picture.
This Week At A Glance
| Instrument | Score | Status | Δ vs Prior Week |
|---|
| TNK | 80/100 |
Green |
Unchanged (Green → Green) |
| DHT | 80/100 |
Green |
Unchanged (Green → Green) |
| FRO | 80/100 |
Green |
Unchanged (Green → Green) |
| INSW | 50/100 |
Orange |
80 → 50 (Green → Orange) |
| ECO | 70/100 |
Yellow |
80 → 70 (Green → Yellow) |
| NAT | 45/100 |
Orange |
80 → 45 (Green → Orange) |
| TEN | 45/100 |
Orange |
80 → 45 (Green → Orange) |
| TK | 80/100 |
Green |
Unchanged (Green → Green) |
| STNG | 30/100 |
Red |
45 → 30 (Orange → Red) |
| ASC | 70/100 |
Yellow |
Unchanged (Yellow → Yellow) |
| TRMD | 45/100 |
Orange |
80 → 45 (Green → Orange) |
| Gold | 100/100 |
Green |
65 → 100 (Yellow → Green) |
| US10Y | 80/100 |
Green |
100 → 80 (Green → Green) |
| DXY | 50/100 |
Orange |
30 → 50 (Red → Orange) |
Teekay Tankers Ltd
Teekay Tankers Ltd
NYSE: TNK
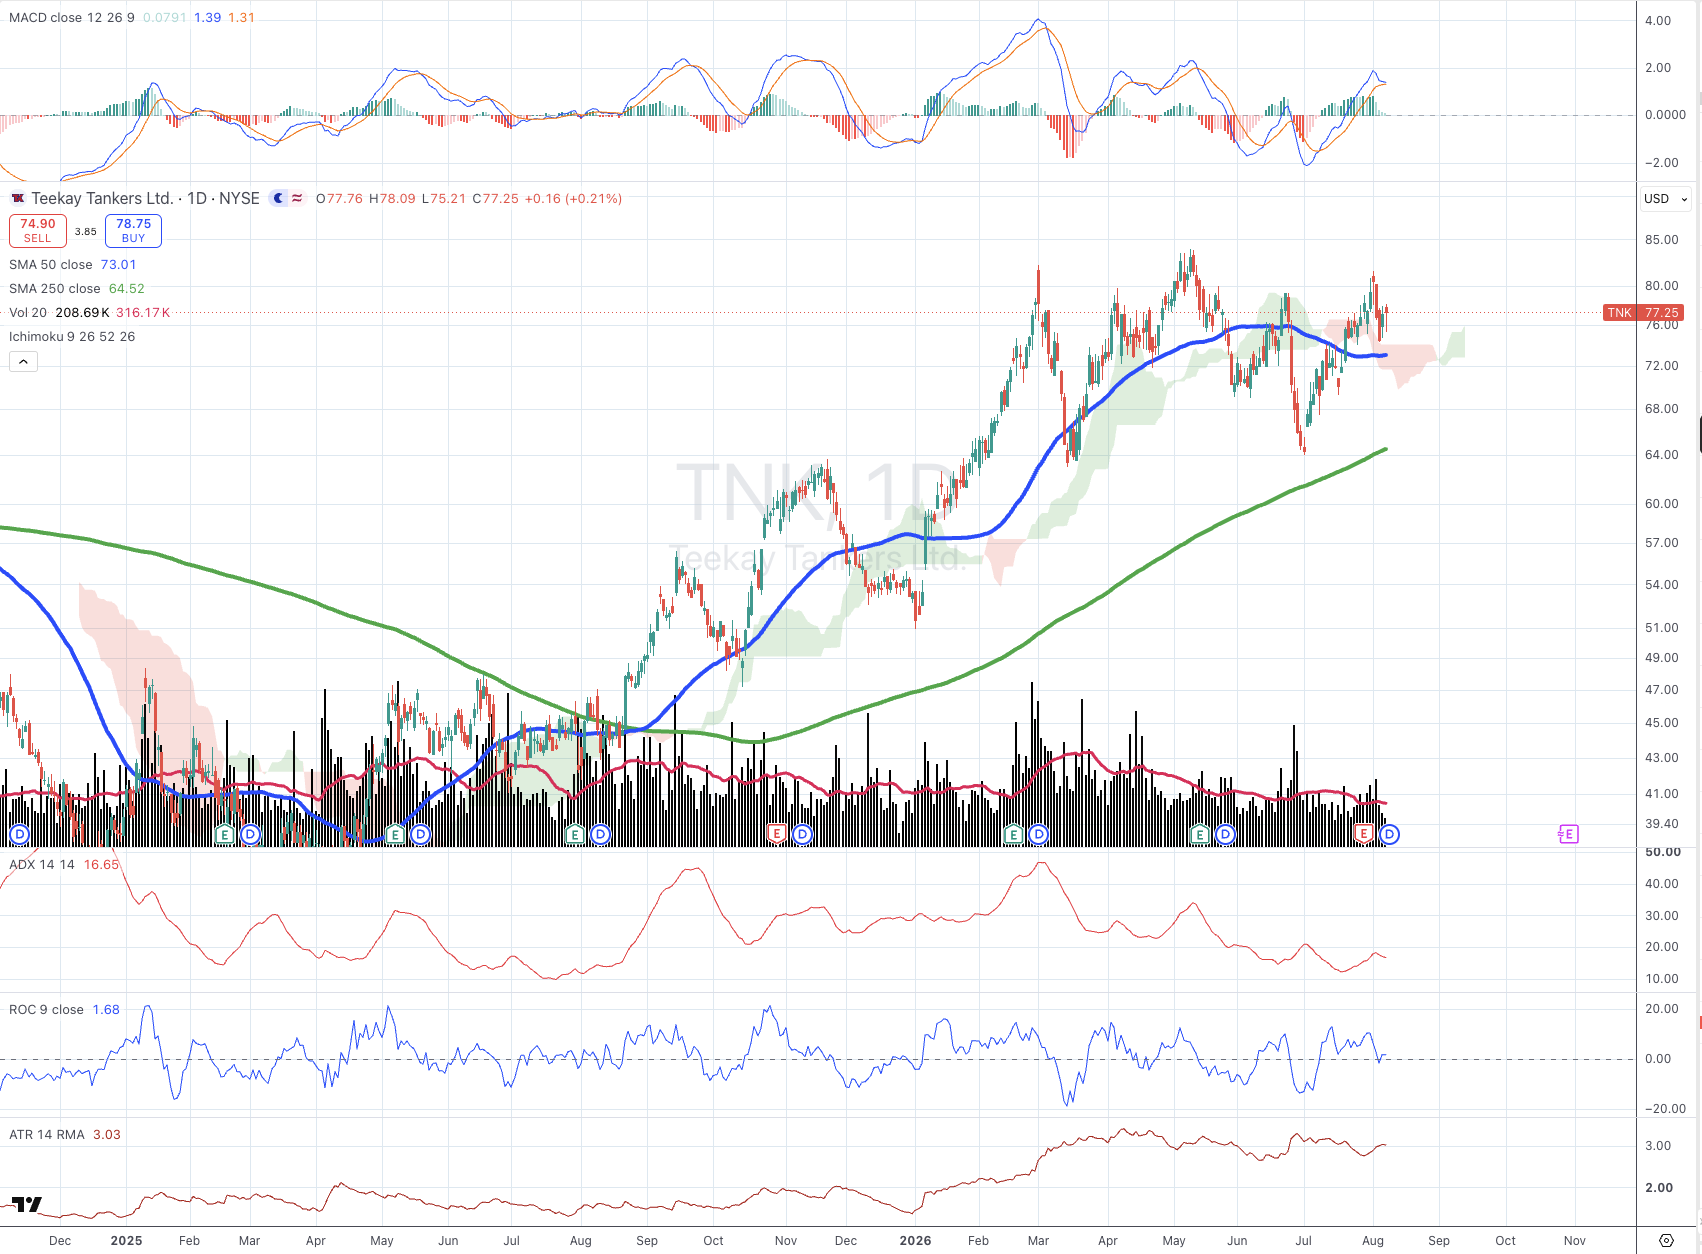
Unchanged from the 1 August read — still 80/Green. Price holds above both the 50-day SMA ($73.01) and 250-day SMA ($64.52), momentum stays bullish (MACD above signal, ROC +1.68), and ADX at 16.65 still falls short of real trend strength. Second straight week confirming the score under the regular weekly cycle.
DHT Holdings, Inc.
DHT Holdings, Inc.
NYSE: DHT
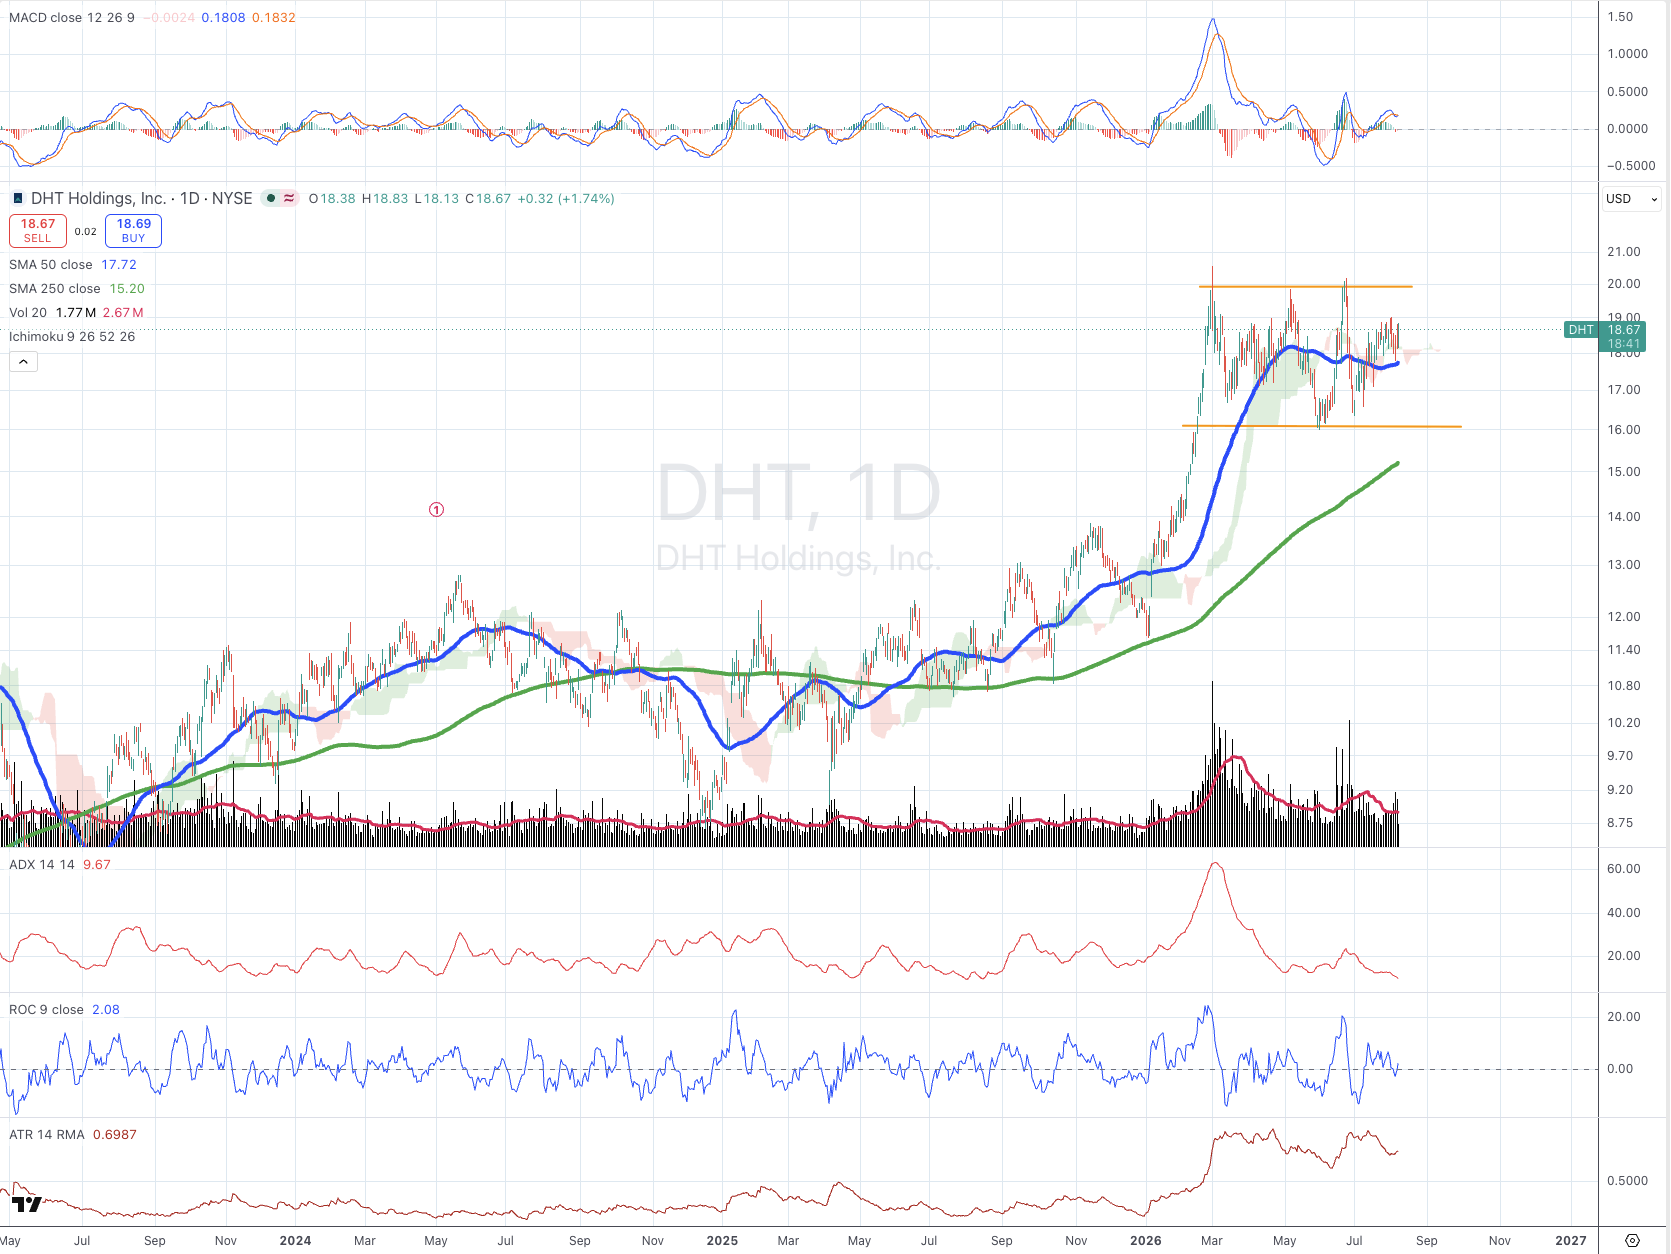
Unchanged from the 1 August read — still 80/Green. Price holds above both the 50-day SMA ($17.72) and 250-day SMA ($15.20), momentum stays bullish (MACD just back above signal, ROC +2.08), and ADX at 9.67 still shows no real directional conviction. Volatility remains contained.
Frontline plc
Frontline plc
NYSE: FRO
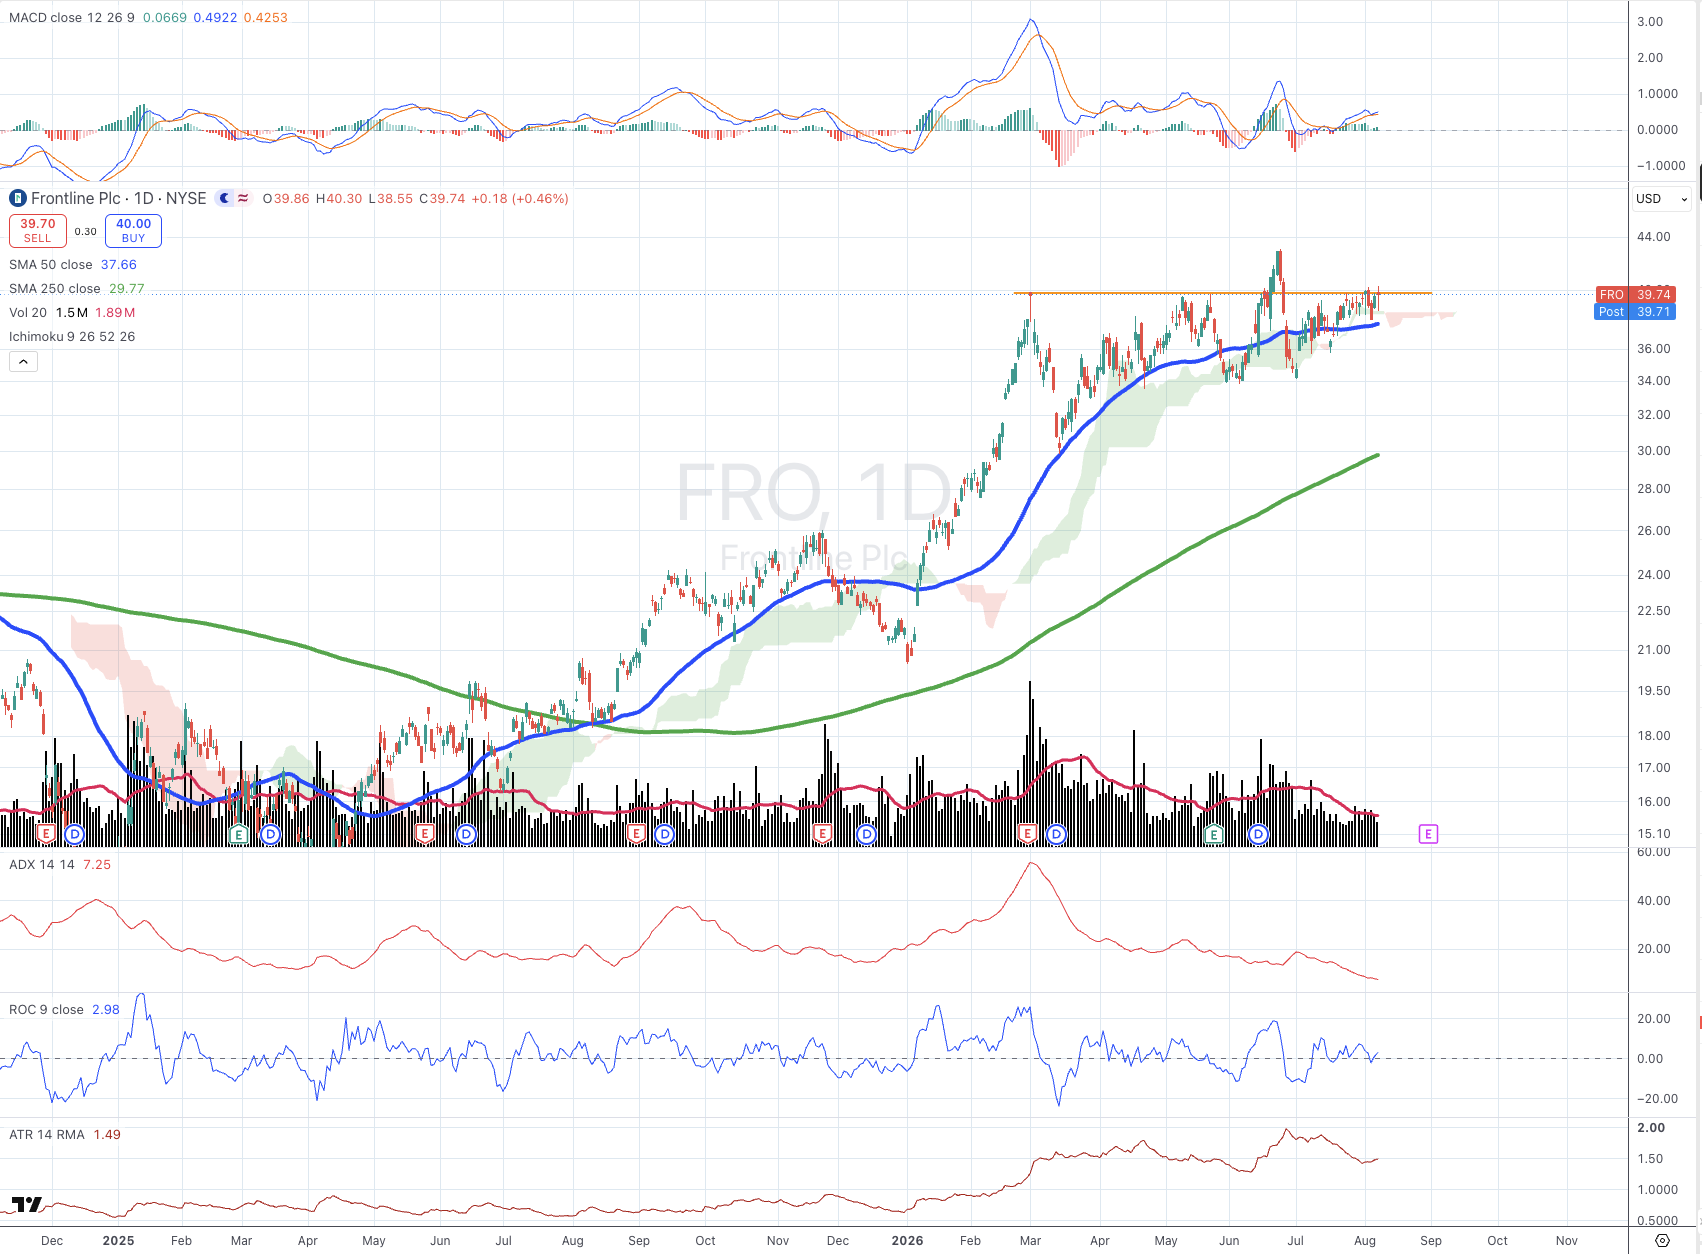
Unchanged from the 1 August read — still 80/Green. Trend intact above both SMAs ($37.66 50-day, $29.77 250-day). Momentum bullish (MACD above signal, ROC +2.98), though ADX at 7.25 — the lowest reading in this batch — confirms there’s no trend-strength conviction behind the move.
International Seaways Inc
International Seaways Inc
NYSE: INSW
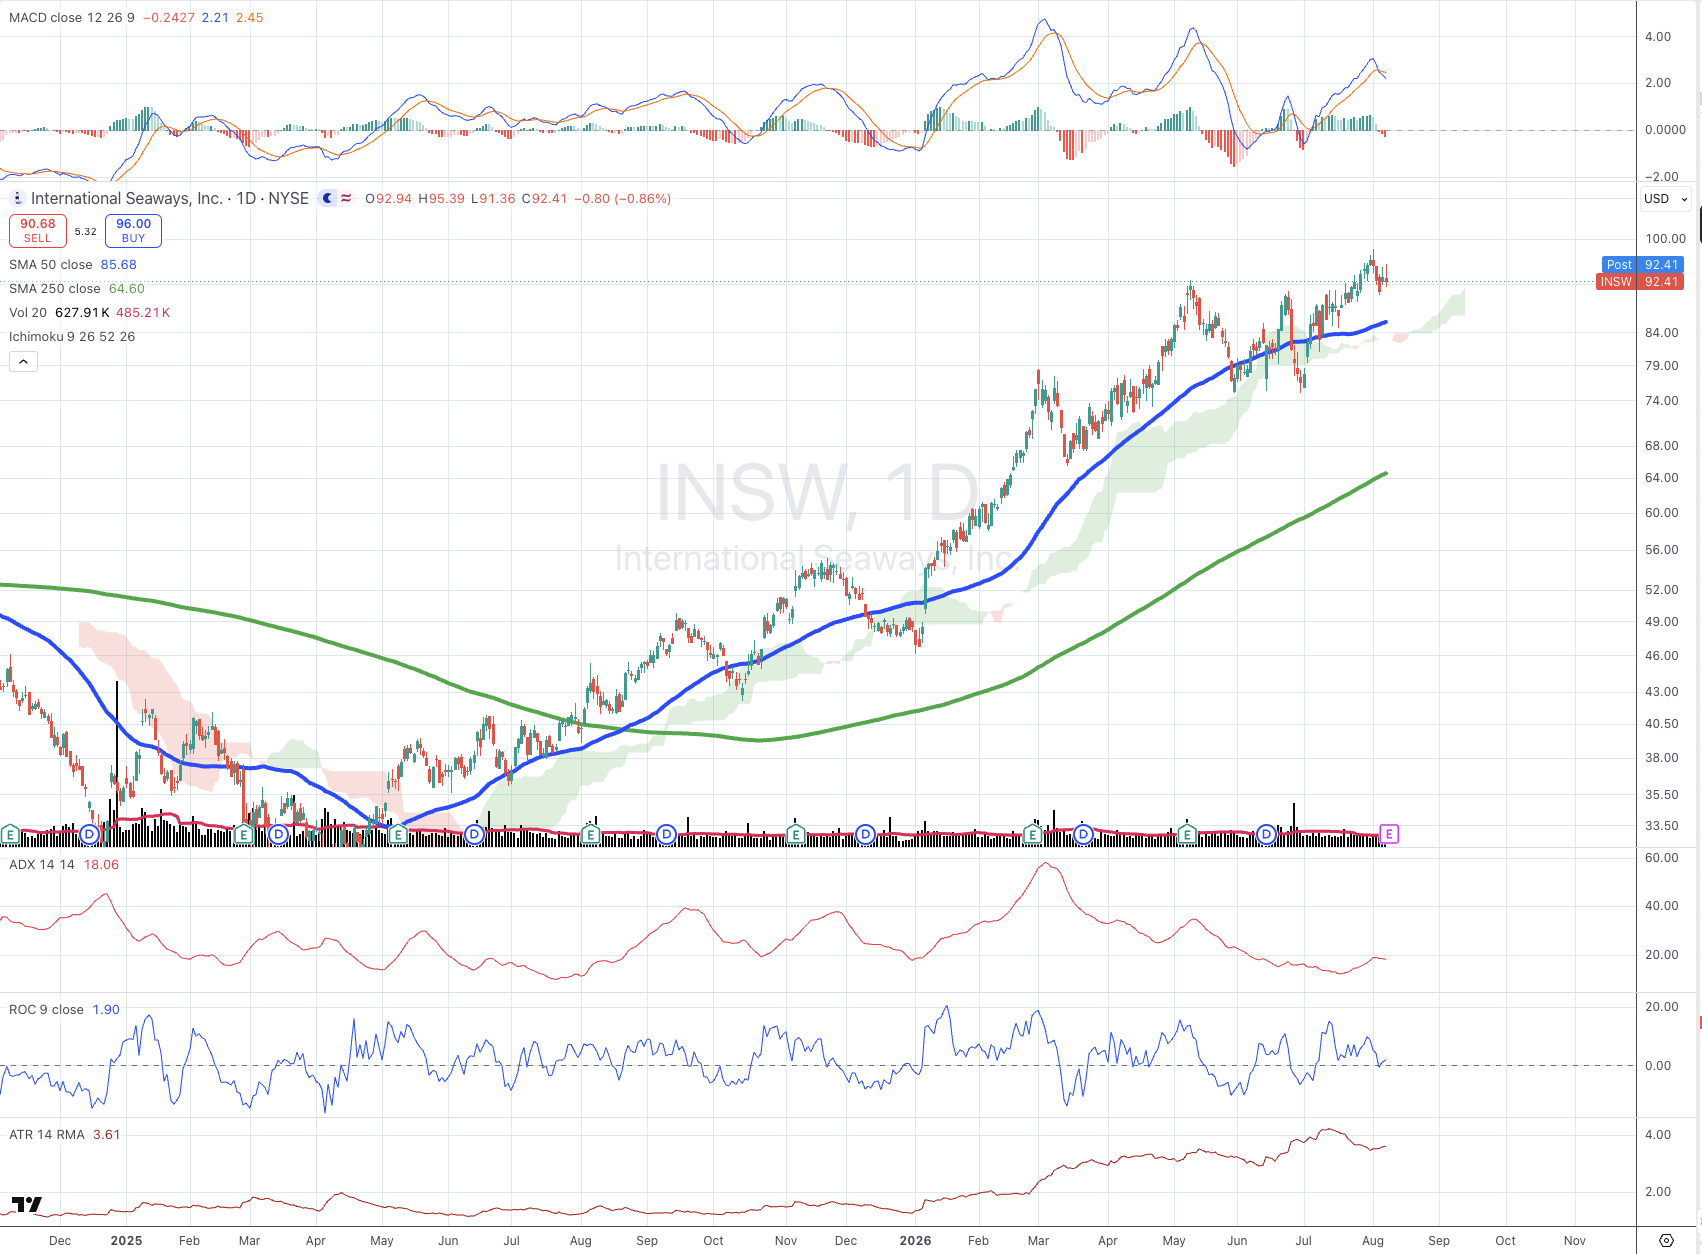
A real deterioration since the provisional read. Trend still fully intact — price well above both the 50 SMA ($85.68) and 250 SMA ($64.60). But momentum has cracked: MACD’s histogram flipped negative at today’s close, even as ROC still prints a marginal +1.90. Volatility is the bigger flag: ATR has more than doubled since March. Worth watching closely ahead of Monday’s Q2 report.
Okeanis Eco Tankers Corp.
Okeanis Eco Tankers Corp.
NYSE/OSE: ECO
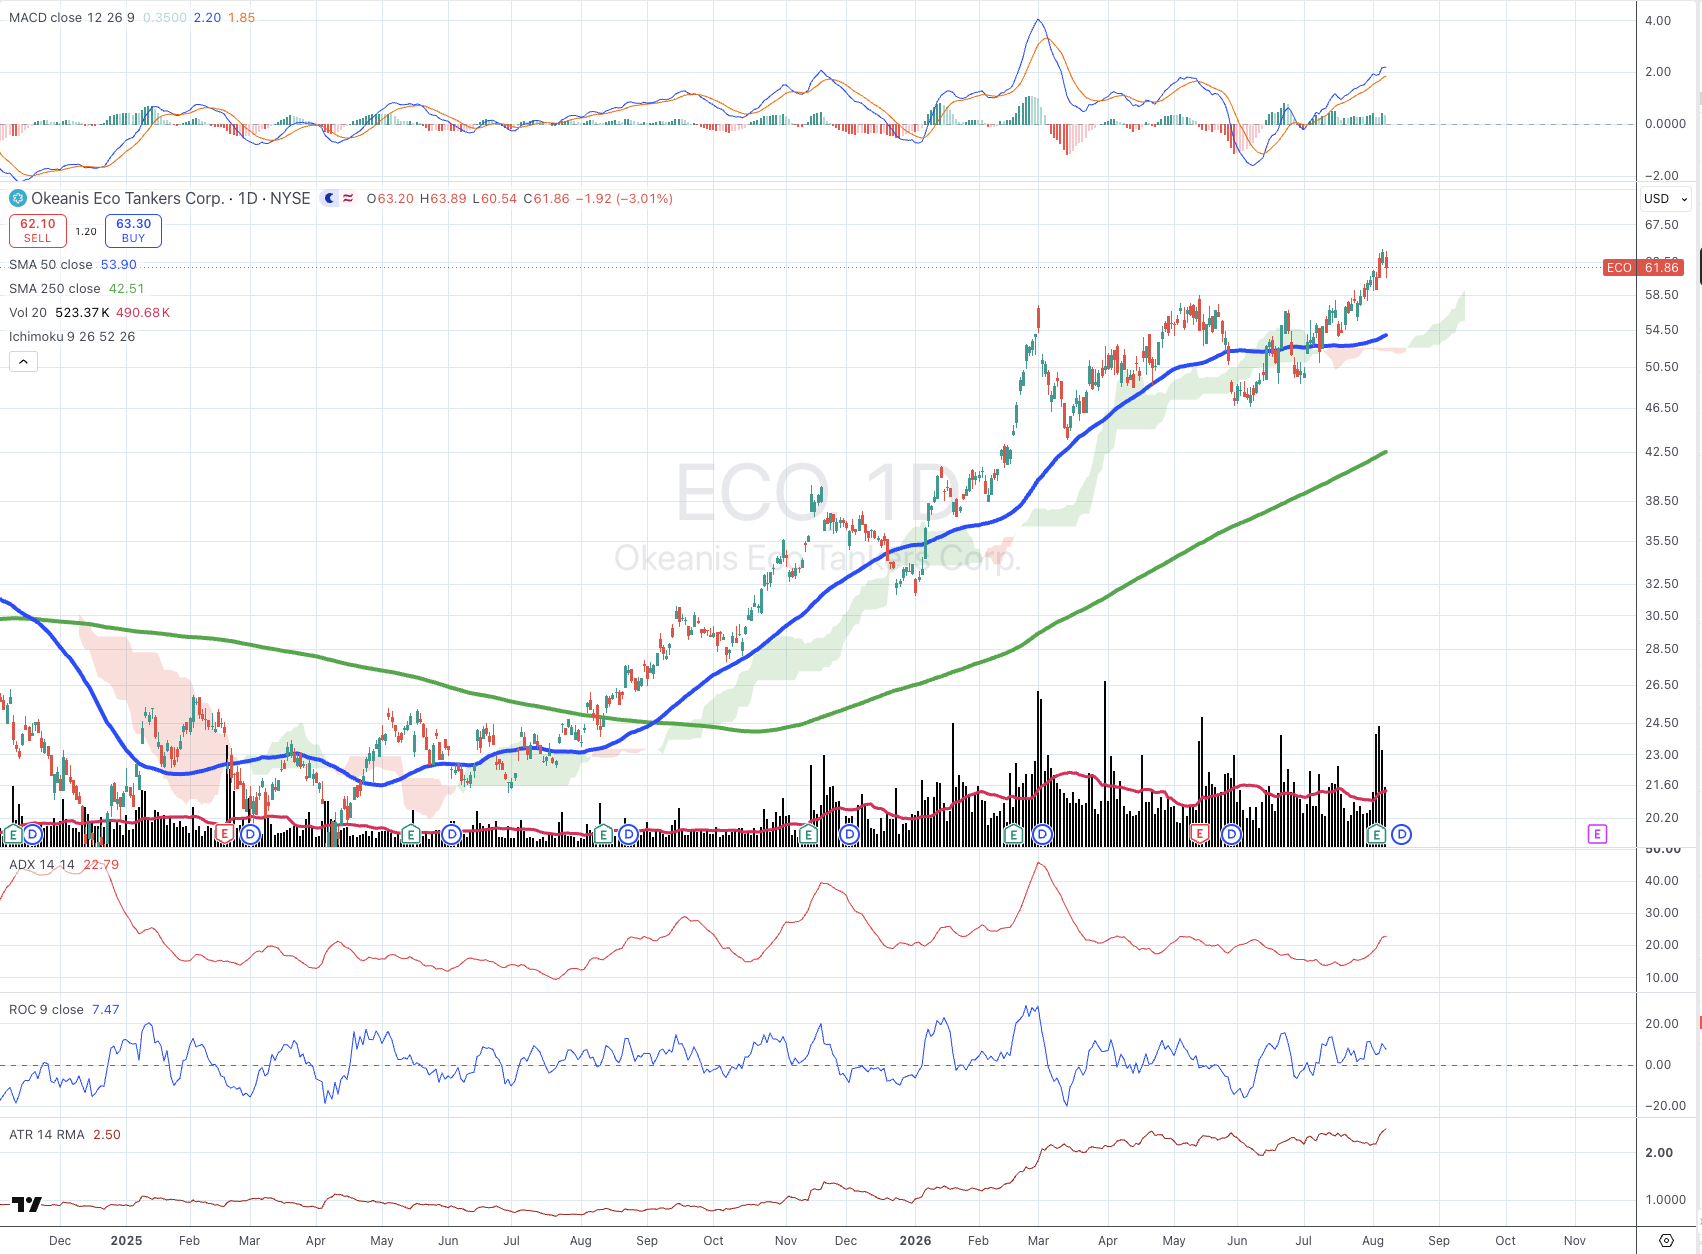
Trend fully intact, price comfortably above both the 50 SMA ($53.90) and 250 SMA ($42.51). Momentum stays bullish (MACD above signal, ROC +7.47 — the strongest reading in the batch), and ADX at 22.79 is the closest any name gets to real trend-strength confirmation. The catch is volatility: ATR spiked sharply on today’s post-earnings 3% pullback, a fresh expansion that costs the full 10 points.
Nordic American Tankers Limited
Nordic American Tankers Limited
NYSE: NAT
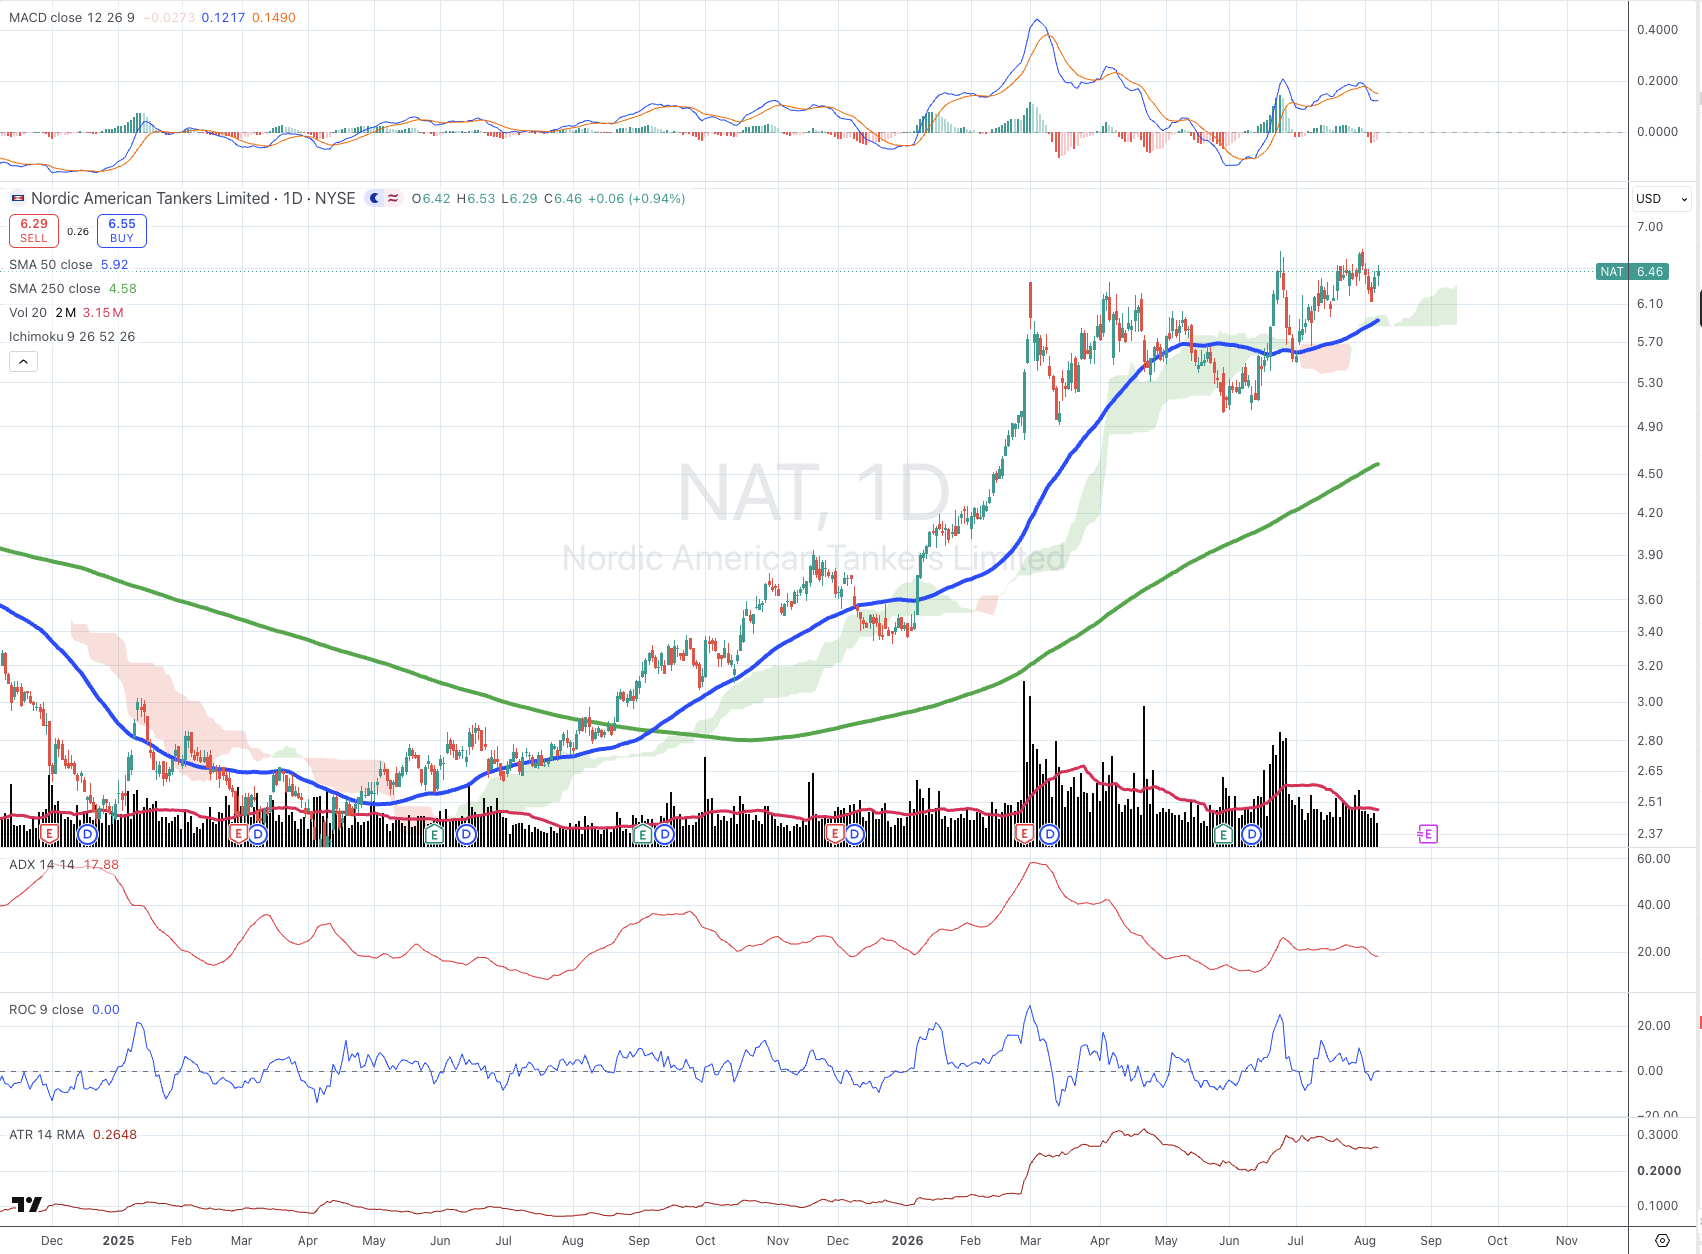
Trend intact, price above both the 50 SMA ($5.92) and 250 SMA ($4.58). But momentum has broken down since 1 August — MACD crossed below signal, and ROC prints exactly flat at 0.00. ADX at 17.88 shows no trend-strength conviction. Volatility has stayed range-bound for months and earns the full 10 points, the one steady category.
Tsakos Energy Navigation Ltd
Tsakos Energy Navigation Ltd
NYSE: TEN
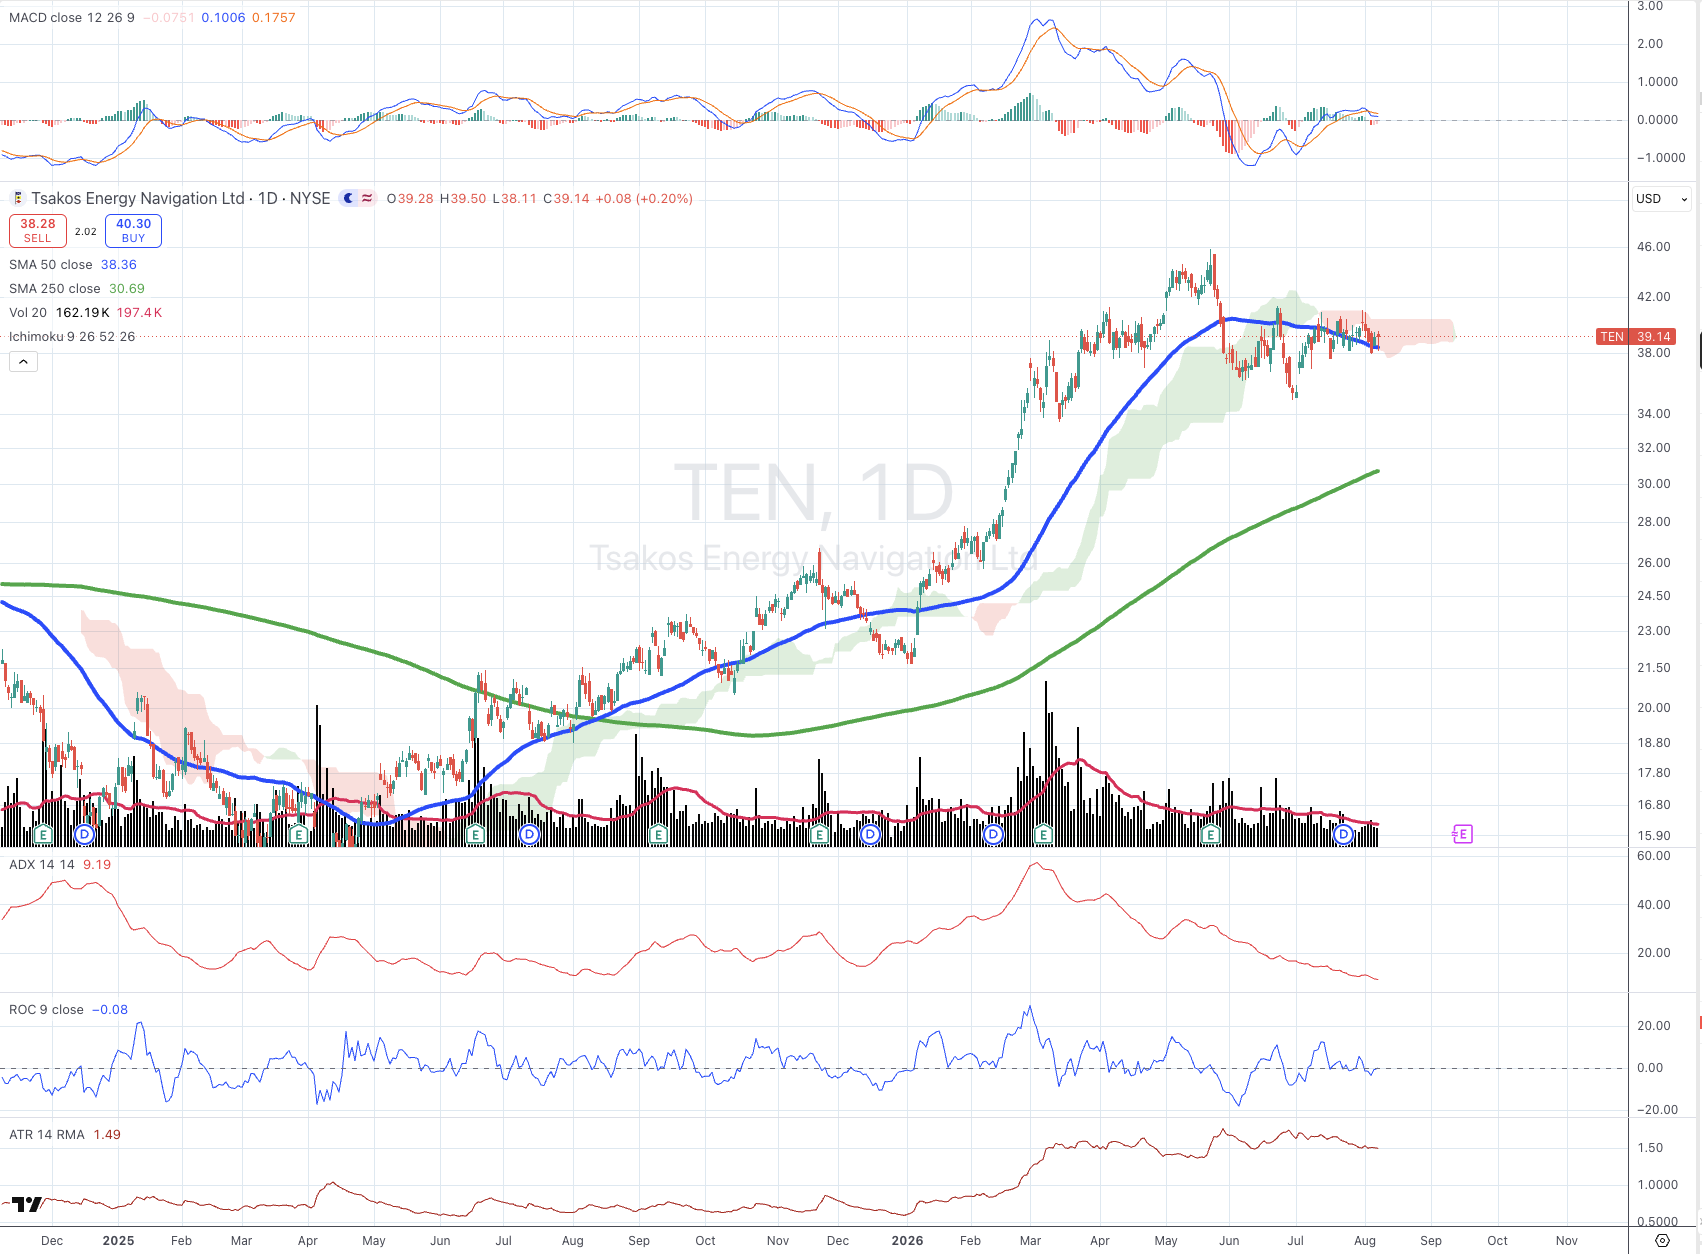
Trend intact, price above both the 50 SMA ($38.36) and 250 SMA ($30.69). Momentum has turned since 1 August — MACD just crossed below signal and ROC prints marginally negative at -0.08. ADX at 9.19 shows no trend-strength conviction. Volatility has settled into a range-bound pattern for months and earns the full 10 points.
Teekay Corporation Ltd
Teekay Corporation Ltd
NYSE: TK
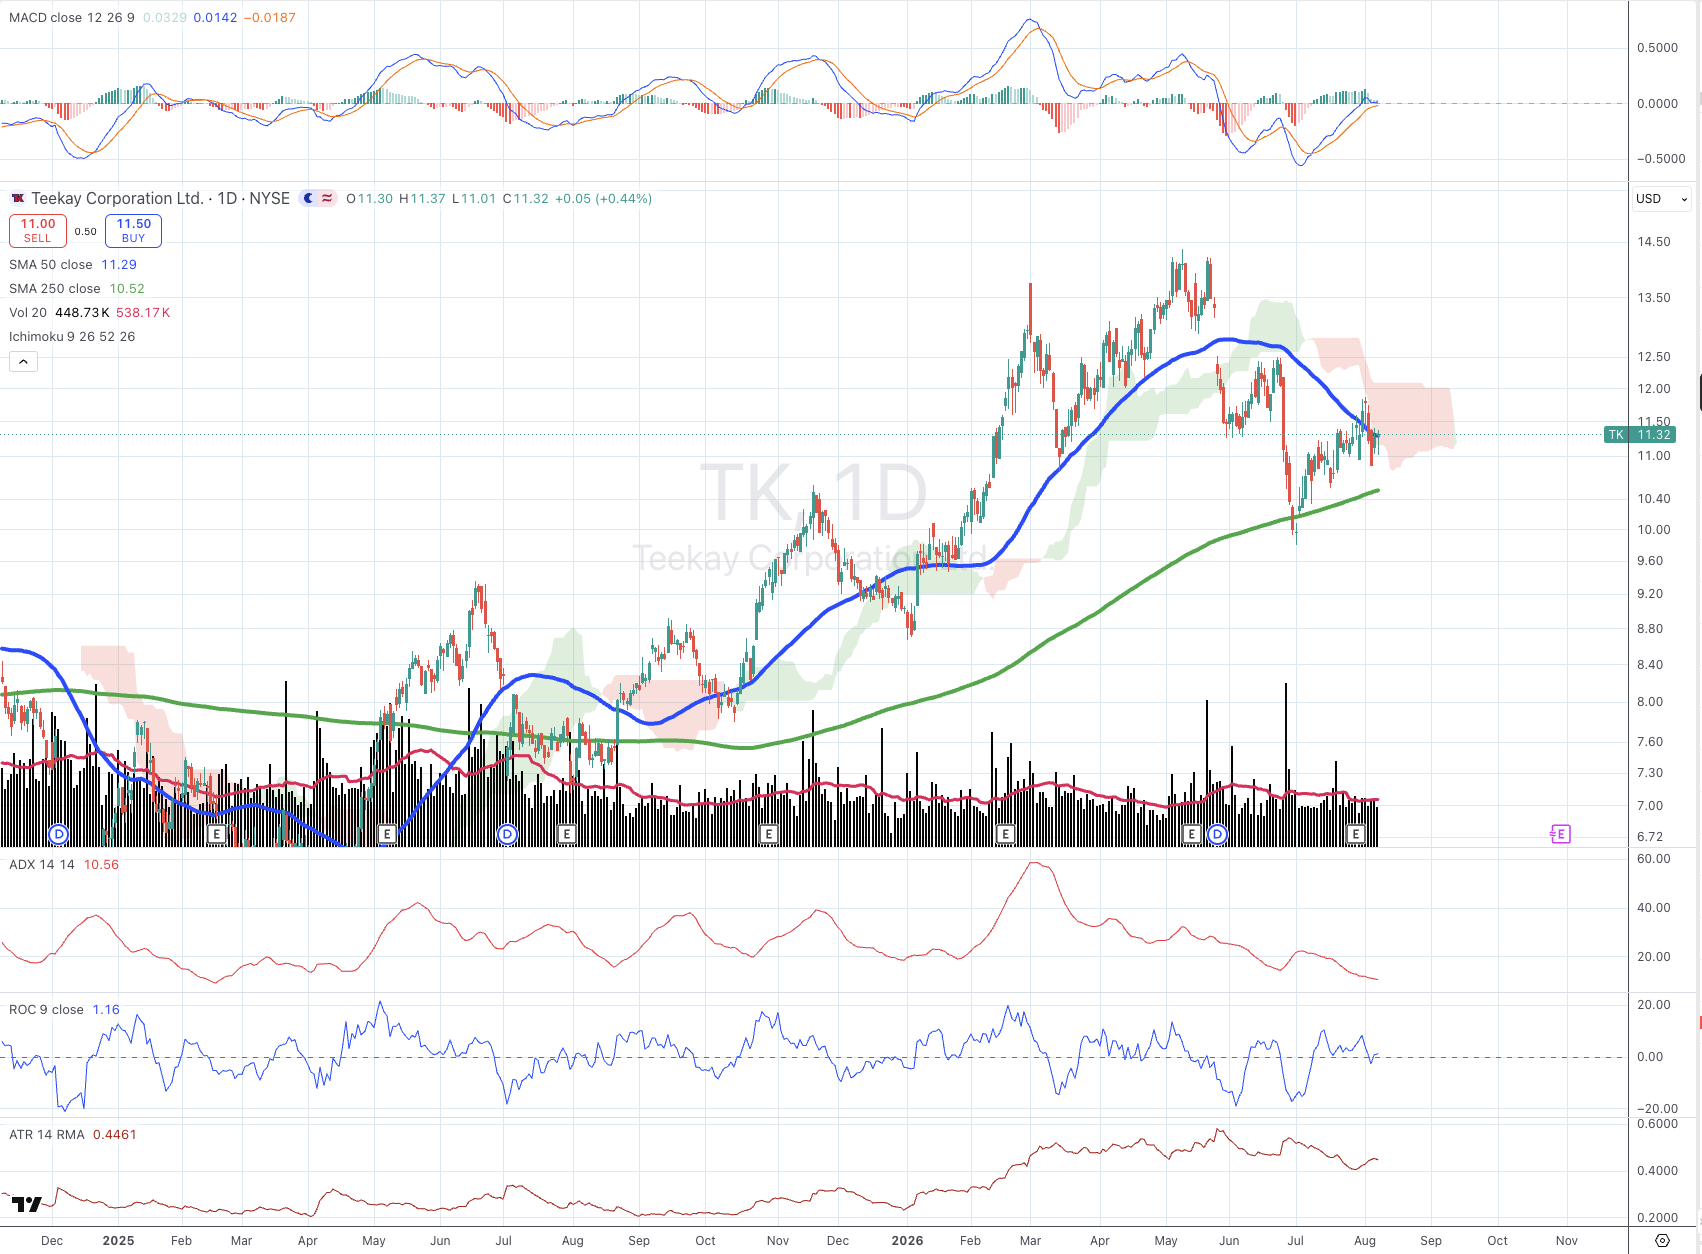
Unchanged from the 1 August read — still 80/Green. Price ($11.32) sits only fractionally above its own 50 SMA ($11.29) — a thin margin, but real — alongside a comfortable cushion above the 250 SMA ($10.52). Momentum stays bullish, MACD just holding above signal with ROC +1.16. ADX at 10.56 shows no trend-strength conviction.
Scorpio Tankers Inc.
Scorpio Tankers Inc.
NYSE: STNG
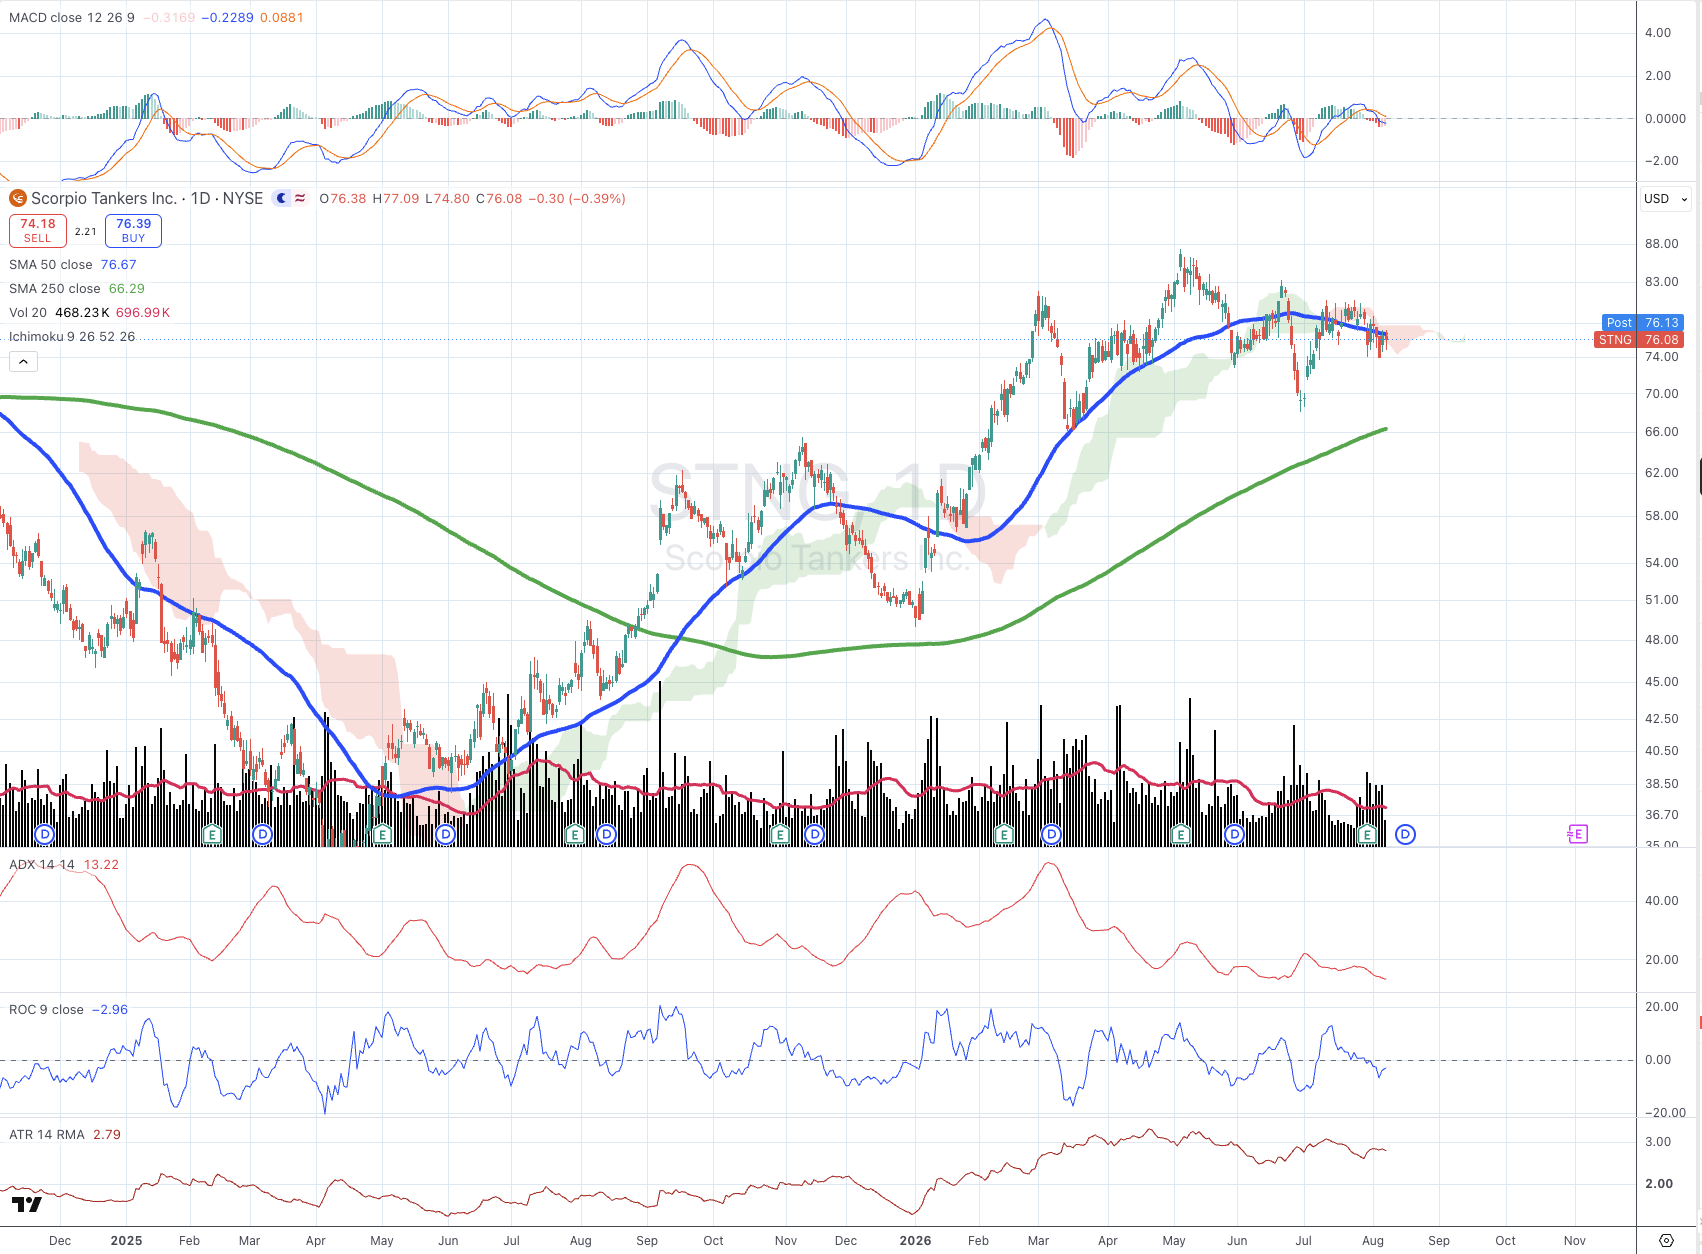
A further slide since the 1 August Orange read. Price has now slipped back below its own 50 SMA ($76.67), though it still holds above the 250 SMA ($66.29). Momentum stays broken down — MACD’s histogram remains negative, ROC has deepened to -2.96. Volatility is the one category still earning points. The weakest reading in this batch, and the second straight week of deterioration.
Ardmore Shipping Corporation
Ardmore Shipping Corporation
NYSE: ASC
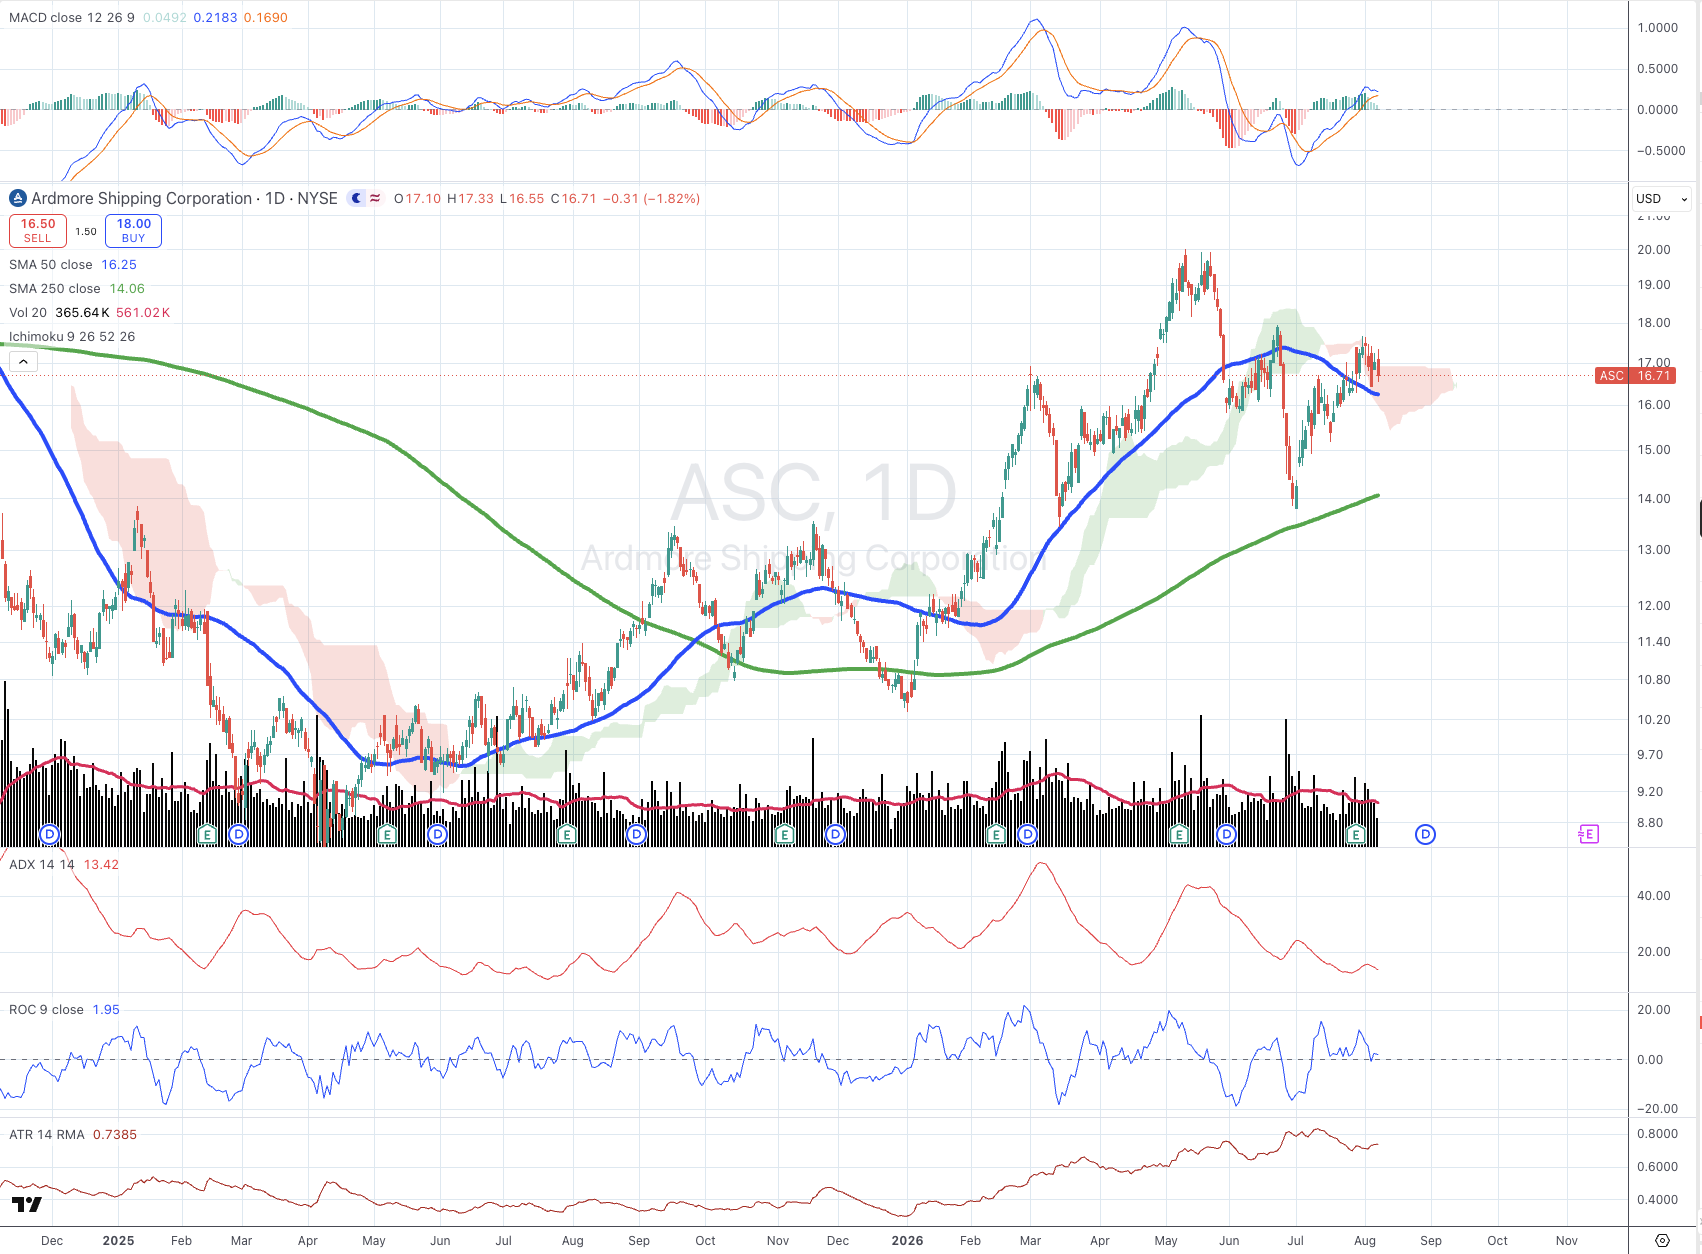
Unchanged from the 1 August read — still 70/Yellow. Trend and momentum both intact (ROC +1.95), and ADX at 13.42 shows no trend-strength conviction. Volatility remains the drag: ATR has kept climbing since June and is still rising into today’s close, the second straight week this has cost the full 10 points.
TORM plc
TORM plc
NASDAQ: TRMD
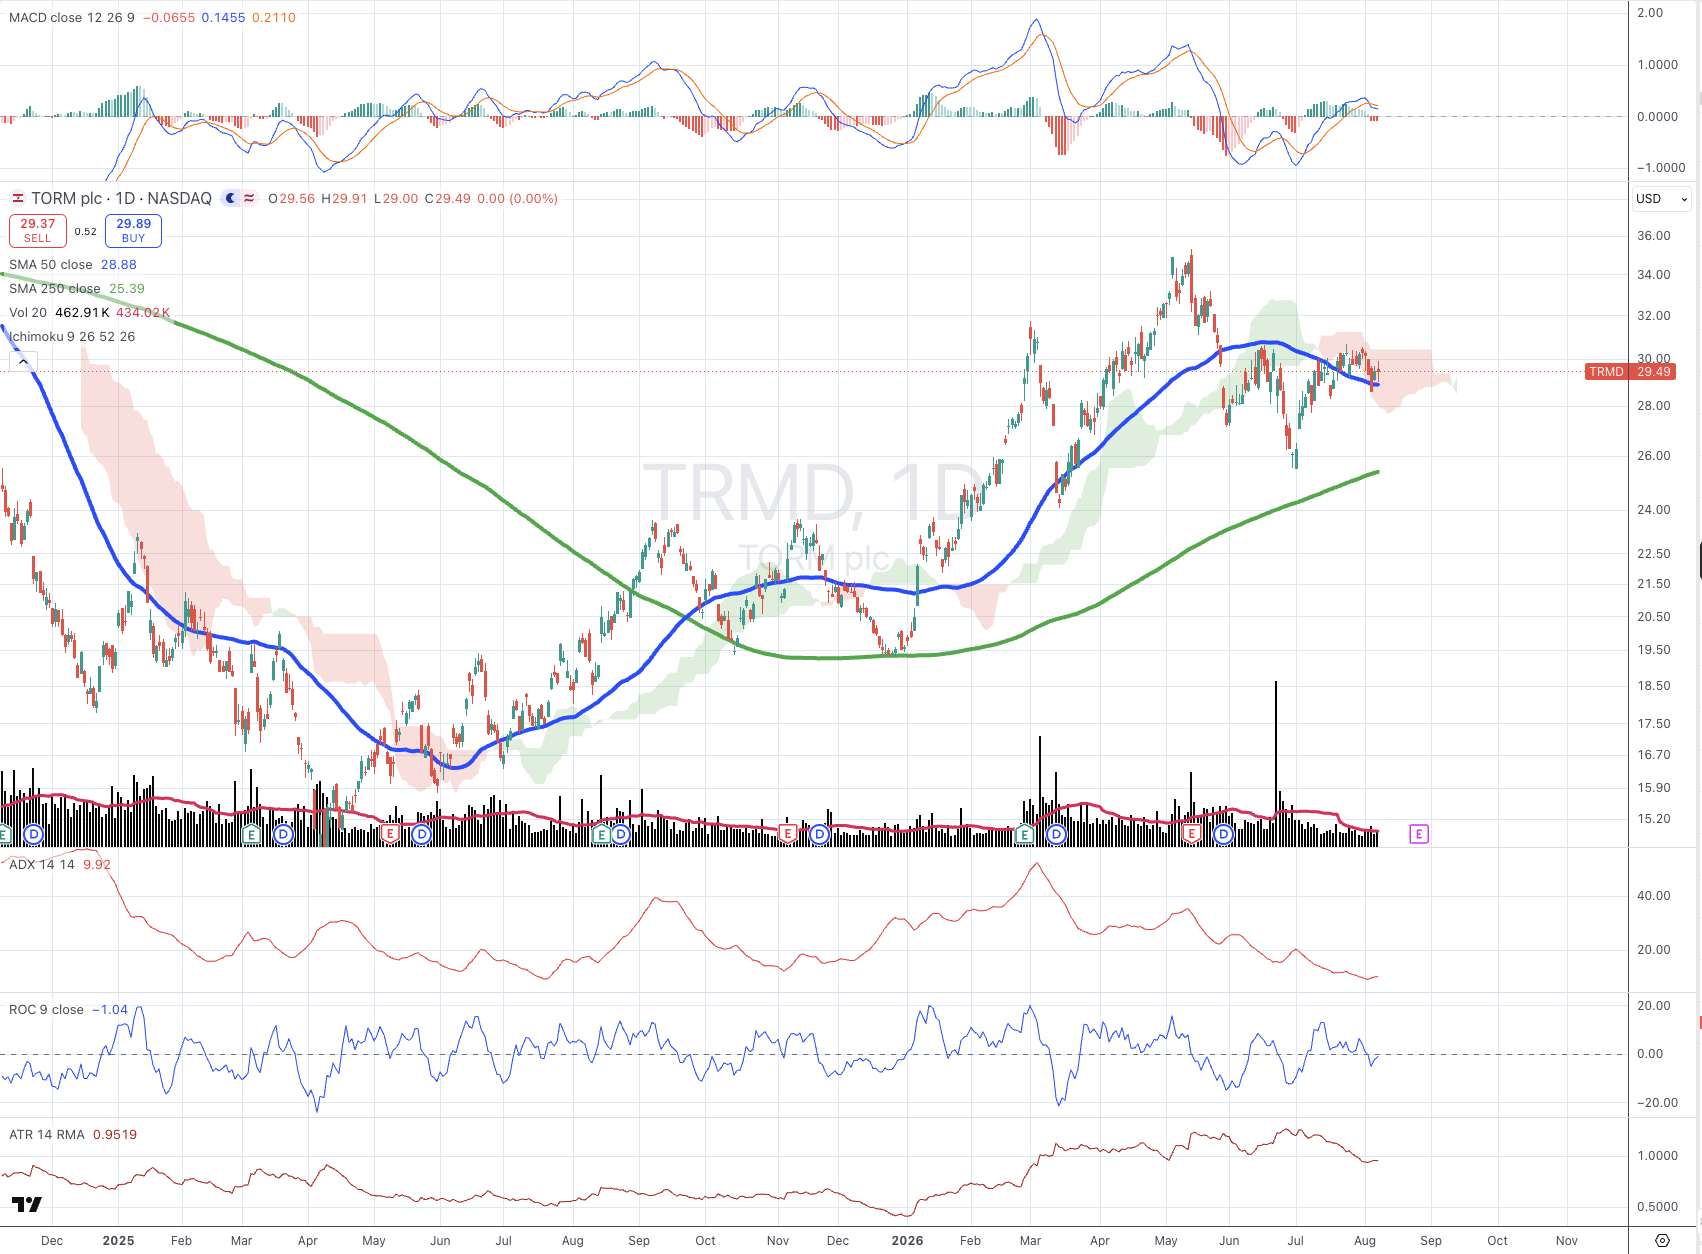
Trend intact, price above both the 50 SMA ($28.88) and 250 SMA ($25.39). But momentum has turned since 1 August — MACD crossed below signal and ROC prints negative at -1.04. ADX at 9.92 shows no trend-strength conviction. Volatility has eased back from a recent local peak and earns the full 10 points.
Gold
Gold
CFDs on Gold (US$/oz)
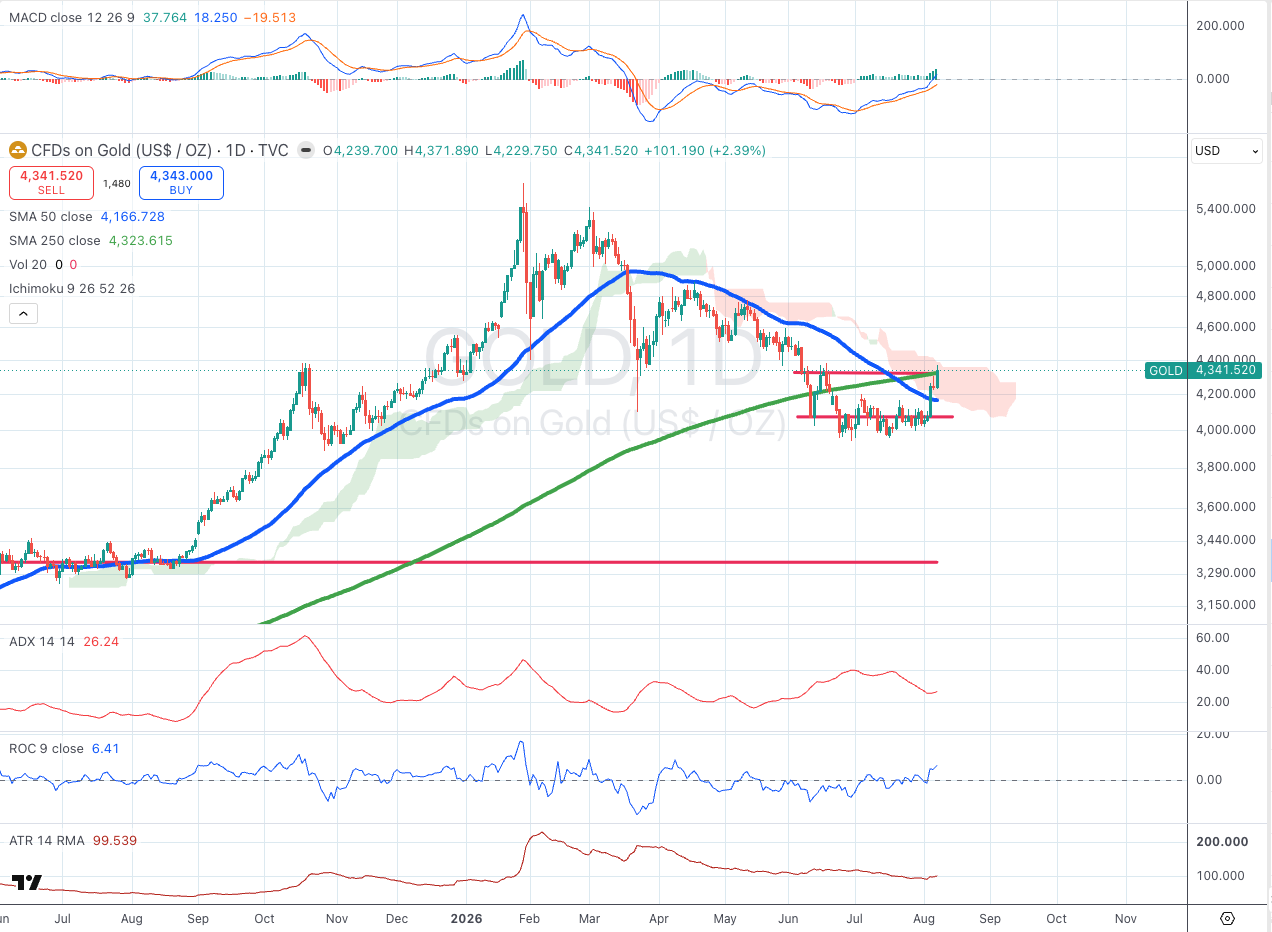
Real improvement since the 1 August read (65/Yellow → 100/Green). Price has now cleared both moving averages — a thin but genuine break above the 250 SMA ($4,323.62) alongside comfortable room above the 50 SMA ($4,166.73). Momentum stays bullish (MACD firmly above signal, ROC +6.41), and ADX at 26.24 clears the 25 trend-strength threshold. Volatility has eased back from its earlier-year spike. Every category maxes out — the strongest read in this batch.
US Government Bonds 10 YR Yield
US Government Bonds 10 YR Yield
TVC: US10Y
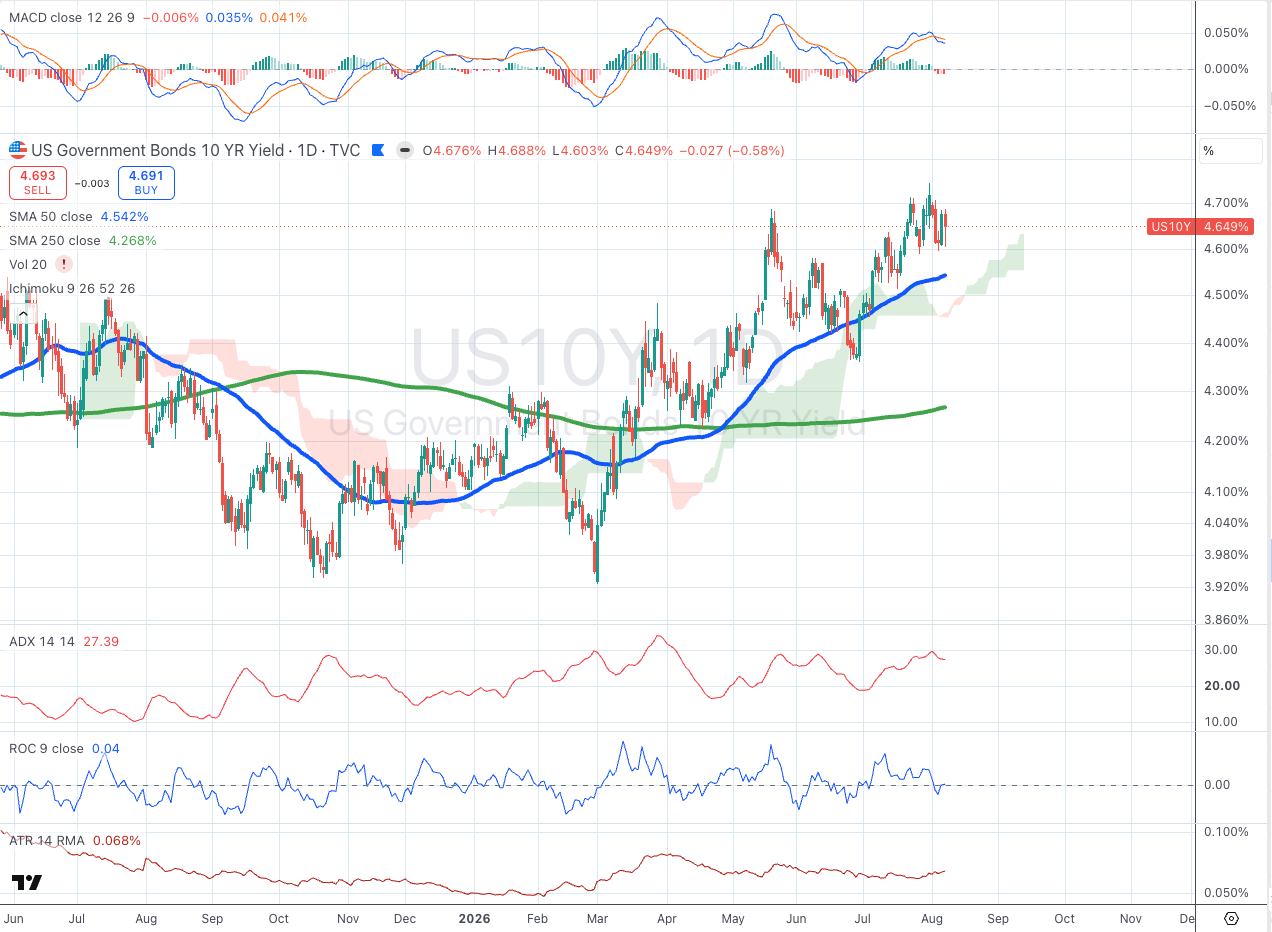
A real but modest step down from the 1 August perfect score (100/100 → 80/100), still Green either way. Yield holds comfortably above both the 50-day (4.542%) and 250-day (4.268%) averages. Momentum has cooled — MACD's histogram just turned marginally negative even as ROC stays barely positive at +0.04 — netting only 15 of 35 momentum points. ADX at 27.39 continues to clear the 25 trend-strength threshold. Still the strongest macro read on the board, just no longer a perfect one.
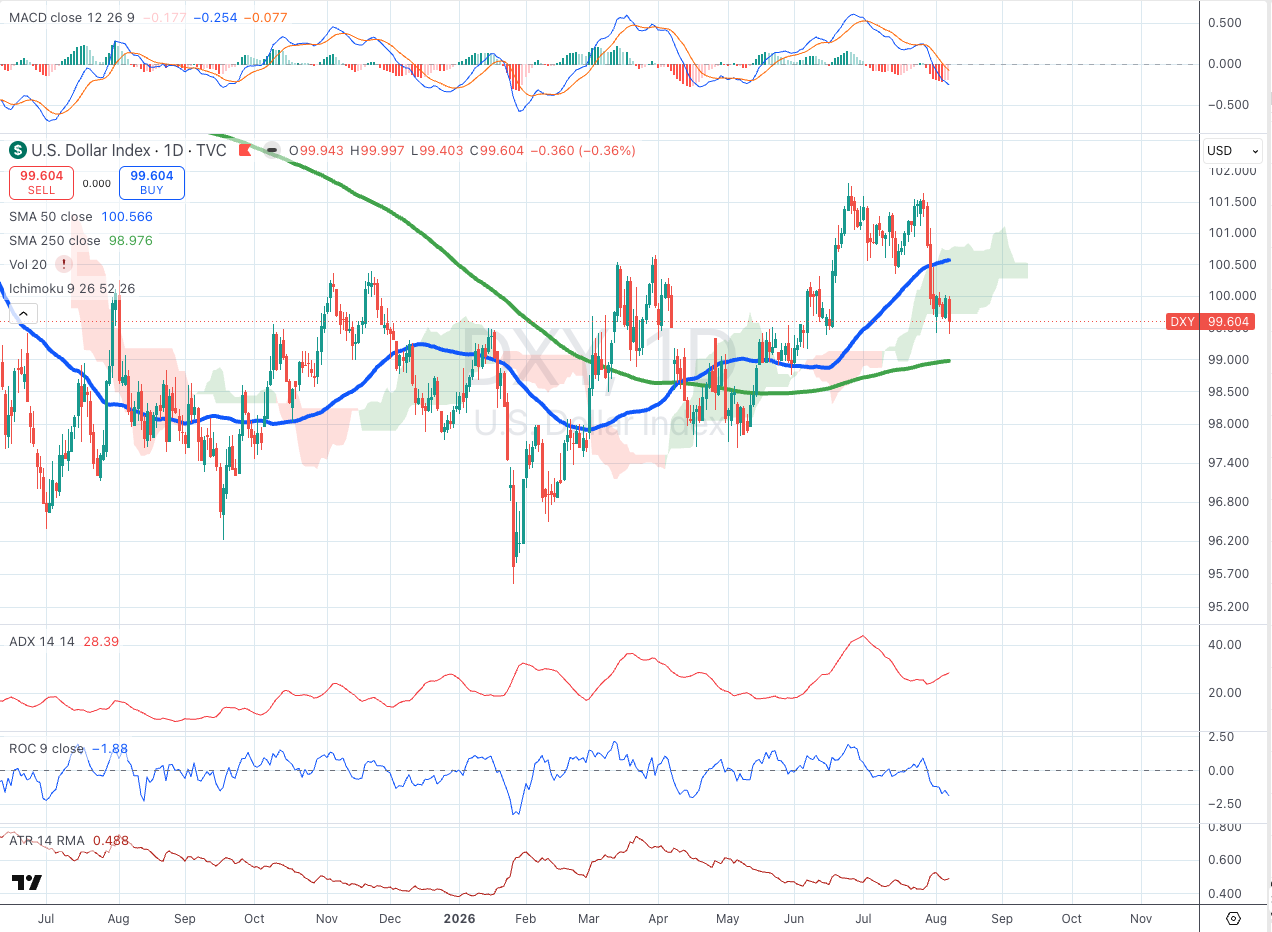
U.S. Dollar Index
U.S. Dollar Index
TVC: DXY
A real improvement since the 1 August read (30/Red → 50/Orange). Price has slipped back below its own 50 SMA (100.566) but holds above the 250 SMA (98.976) — the same partial trend picture as a week ago. Momentum stays bearish (MACD below signal, ROC -1.88), but ADX at 28.39 now clears the 25 trend-strength threshold — a genuine directional move lower is underway, unlike the near-miss on 1 August. Volatility continues to contract.