Strait Intelligence · Strait Signal
Macro · Weekly Chart Review
U.S. Dollar Index
TVC: DXY
Strait Signal — Technical Score
Score
50/100
Orange
Prior entry (1 Aug 2026): 30/100 → Red. Real improvement — Red → Orange.
Trend · 20/35
Price > 250 SMA✓ +20
Price > 50 SMA✗ +15
Momentum · 0/35
MACD bullish✗ +20
ROC positive✗ +15
Trend Strength · 20/20
ADX > 25(value: 28.39)✓ +20
Volatility · 10/10
ATR vs 50d avg(stable, visual estimate)✓ +10
Note: A real improvement since the 1 August read (30/Red → 50/Orange). Price has slipped back below its own 50 SMA (100.566) but holds above the 250 SMA (98.976) — the same partial trend picture as a week ago. Momentum stays bearish (MACD below signal, ROC -1.88), but ADX at 28.39 now clears the 25 trend-strength threshold — a genuine directional move lower is underway, unlike the near-miss on 1 August. Volatility continues to contract. The status change reflects a confirmed downtrend with real technical conviction behind it, not just a soft dollar.
Chart
Daily Chart SMA / ADX / MACD / ROC / ATR · click to enlarge
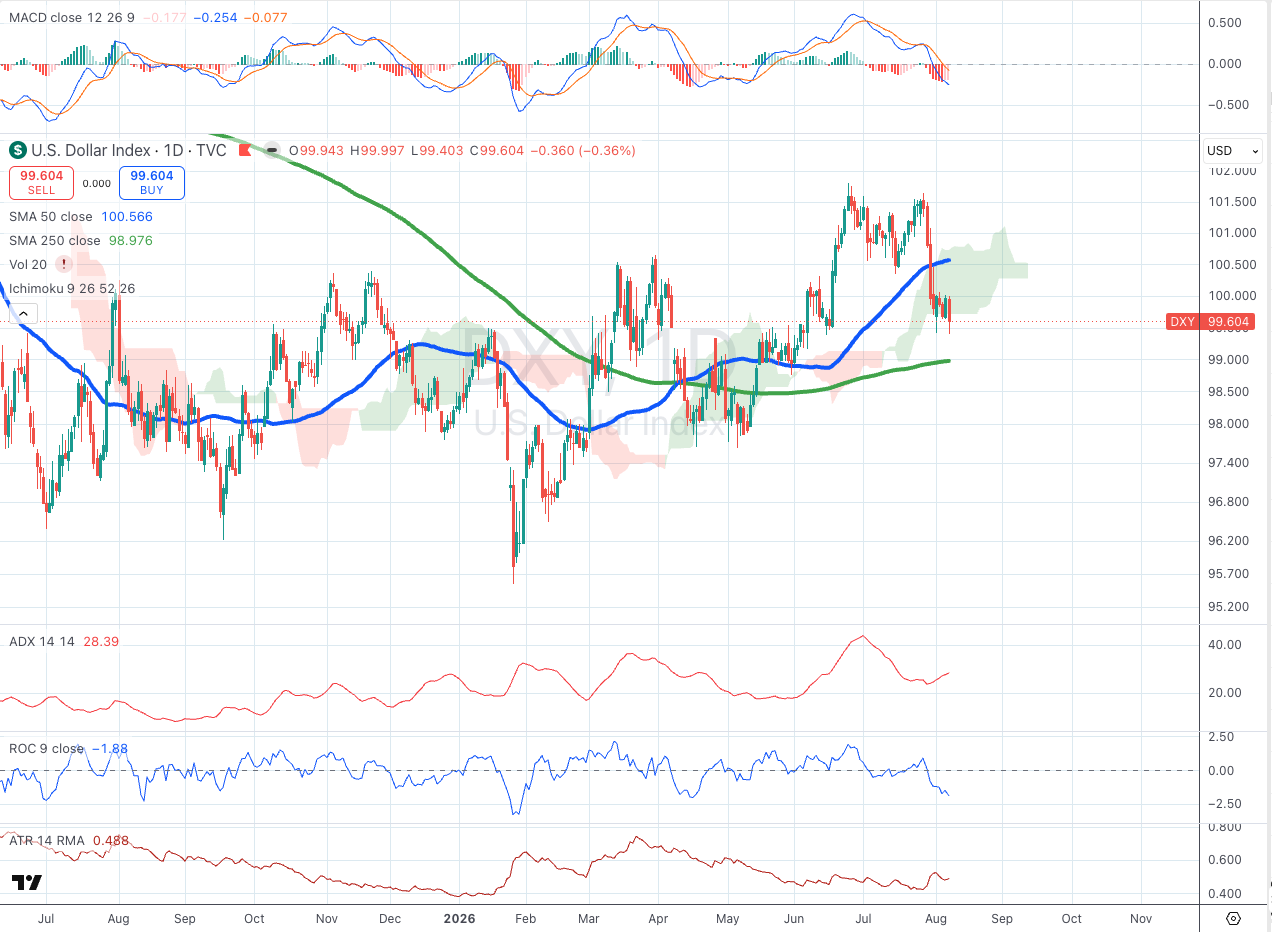
DXY's move from Red to Orange is a case where a worse-sounding headline (ADX crossing into trend-strength-confirmed territory) actually improves the score, because the composite rewards conviction over direction. The trend picture is unchanged from 1 August — price below the 50-day, above the 250-day, a partial score either way. Momentum stays bearish on both counts. What changed is ADX, which closed the gap from 24.45 (a near-miss) to 28.39, confirming this is now a real trending move lower rather than aimless chop. Volatility keeps contracting. Read plainly: the Dollar Index's downtrend has gone from tentative to technically confirmed — worth watching given the read-through to Brent and gold pricing.