Strait Intelligence · Strait Signal
Tanker · Weekly Chart Review
Scorpio Tankers Inc.
NYSE: STNG
Strait Signal — Technical Score
Score
30/100
Red
Prior entry (1 Aug 2026): 45/100 → Orange. Real decline — Orange → Red.
Trend · 20/35
Price > 250 SMA✓ +20
Price > 50 SMA✗ +15
Momentum · 0/35
MACD bullish✗ +20
ROC positive✗ +15
Trend Strength · 0/20
ADX > 25(value: 13.22)✗ +20
Volatility · 10/10
ATR vs 50d avg(stable, visual estimate)✓ +10
Note: A further slide since the 1 August Orange read. Price has now slipped back below its own 50 SMA ($76.67), though it still holds above the 250 SMA ($66.29) — a partial trend score, not a full one. Momentum stays broken down: MACD’s histogram remains negative and ROC has deepened to -2.96. ADX at 13.22 shows no trend-strength conviction either way. Volatility is the one category still earning points, holding in a stable range. Score falls from 45/Orange to 30/Red — the weakest reading in this batch, and the second straight week of deterioration.
Chart
Daily Chart SMA / ADX / MACD / ROC / ATR · click to enlarge
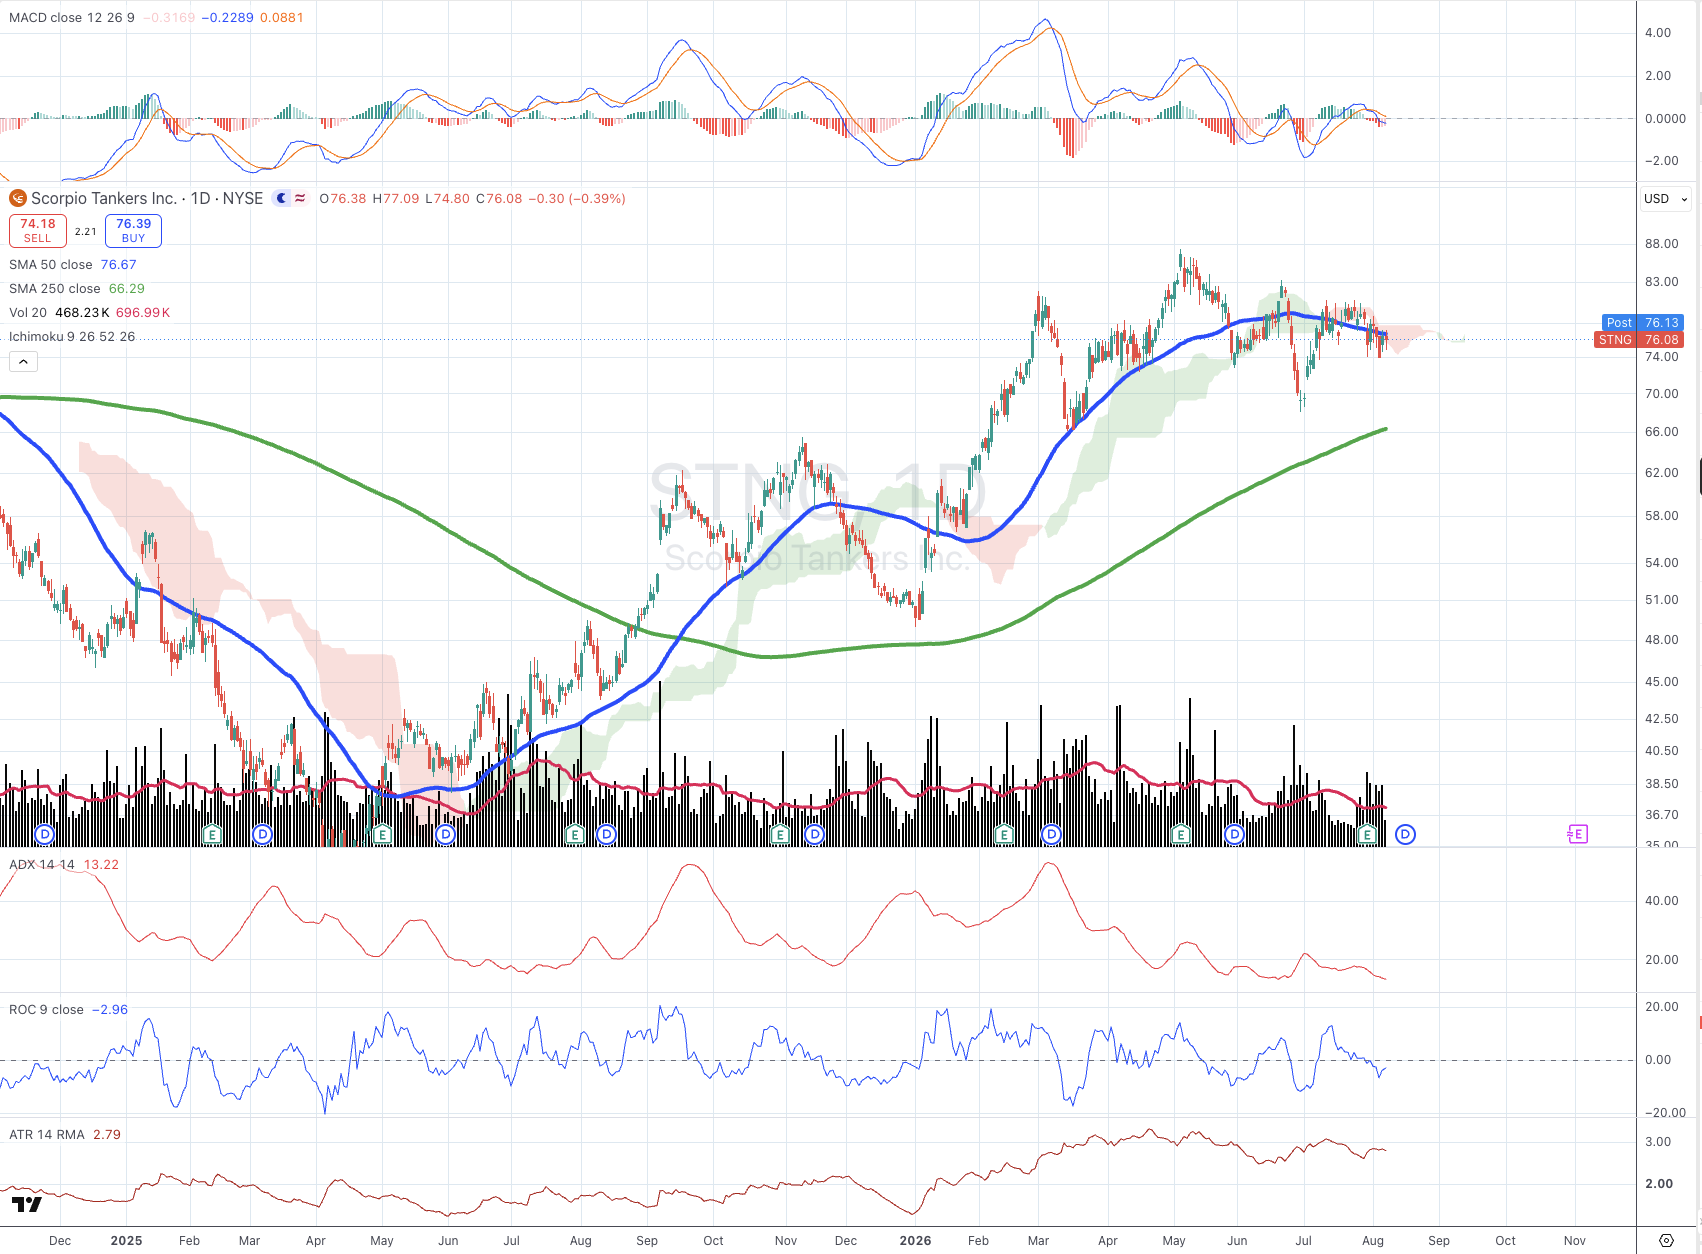
STNG is now two straight weeks of deterioration and the weakest score in this week’s coverage. Price has slipped back below its own 50-day SMA even as it holds above the longer 250-day average — a partial trend score rather than a clean breakdown, but a real one. Momentum remains broken: MACD’s histogram stays negative and ROC has deepened further into negative territory, confirming the bearish crossover flagged at the 1 August read has not reversed. ADX at 13.22 shows no directional conviction in either direction. Volatility is the lone bright spot, holding in a stable range rather than expanding further. With the stock rolling over from its June/July highs and now testing the 50-day from below, this is the name in the batch most worth watching closely into next week.