Strait Intelligence · Strait Signal
Macro · Weekly Chart Review
US Government Bonds 10 YR Yield
TVC: US10Y
Strait Signal — Technical Score
Score
80/100
Green
Prior entry (1 Aug 2026): 100/100 → Green. Real decline, still Green.
Trend · 35/35
Price > 250 SMA✓ +20
Price > 50 SMA✓ +15
Momentum · 15/35
MACD bullish✗ +20
ROC positive✓ +15
Trend Strength · 20/20
ADX > 25(value: 27.39)✓ +20
Volatility · 10/10
ATR vs 50d avg(stable, visual estimate)✓ +10
Note: A real but modest step down from the 1 August perfect score (100/100 → 80/100), still Green either way. Yield holds comfortably above both the 50-day (4.542%) and 250-day (4.268%) averages. Momentum has cooled — MACD's histogram just turned marginally negative even as ROC stays barely positive at +0.04, the closest call in this batch — netting only 15 of 35 momentum points. ADX at 27.39 continues to clear the 25 trend-strength threshold. Volatility has eased off its spring peak. Still the strongest macro read on the board, just no longer a perfect one.
Chart
Daily Chart SMA / ADX / MACD / ROC / ATR · click to enlarge
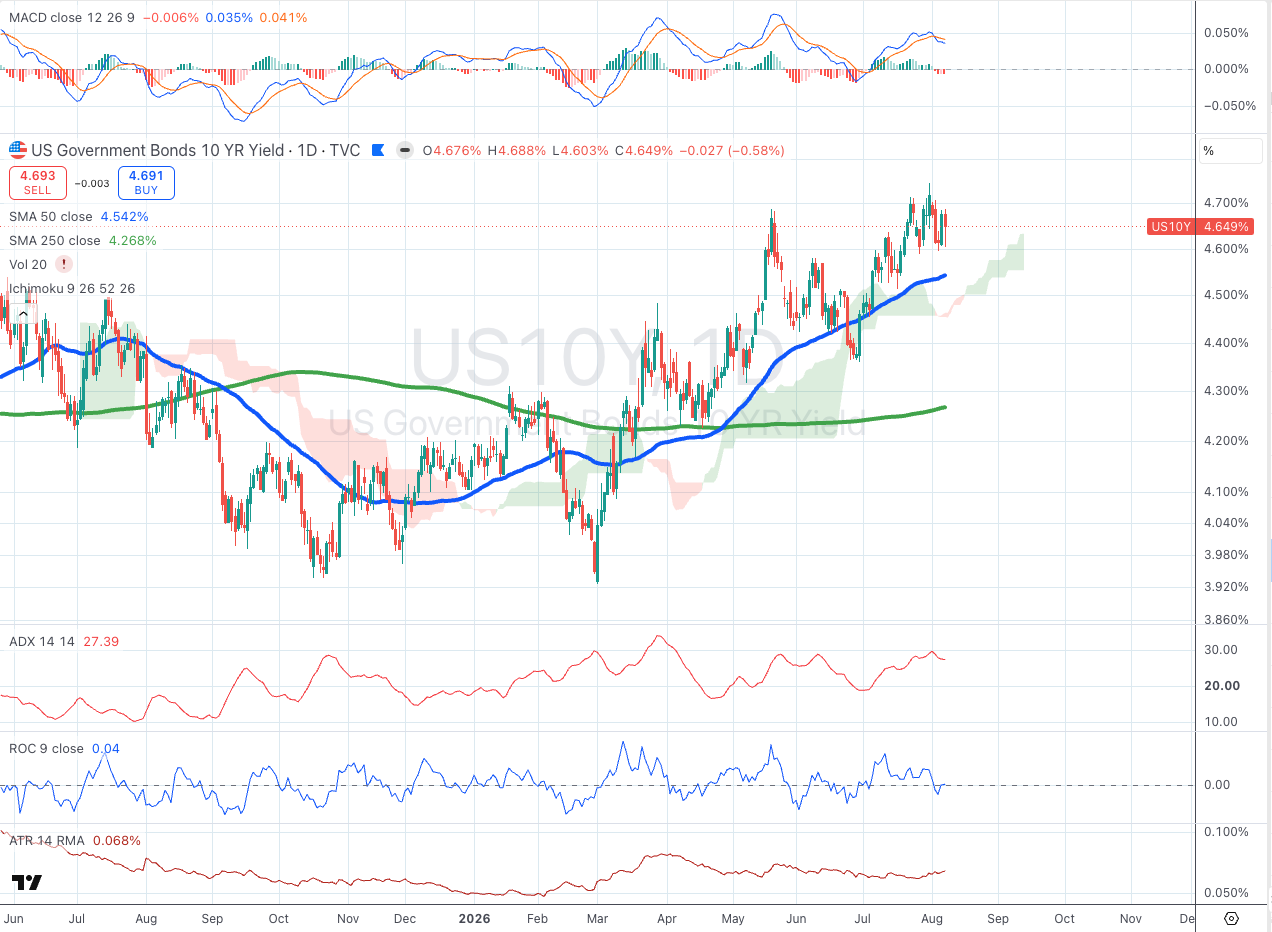
US10Y comes off the only perfect score in the 1 August batch, but the story underneath remains constructive. Trend stays fully intact, yield holding well clear of both moving averages after the sharp move higher since spring. The change is entirely in momentum: MACD's histogram has just turned marginally negative, a fresh but shallow crossover, while ROC holds on to a barely-positive +0.04 — the two indicators essentially splitting the difference rather than confirming a clean reversal. ADX at 27.39 keeps this the most trend-strength-confirmed instrument in the whole coverage list alongside DXY. Volatility has eased meaningfully off its spring peak. This reads as a strong uptrend pausing to digest gains, not breaking down.