Strait Intelligence · Strait Signal
Tanker · Weekly Chart Review
TORM plc
NASDAQ: TRMD
Strait Signal — Technical Score
Score
80/100
Green
First entry on file — no prior week to compare.
Trend · 35/35
Price > 250 SMA✓ +20
Price > 50 SMA✓ +15
Momentum · 35/35
MACD bullish✓ +20
ROC positive✓ +15
Trend Strength · 0/20
ADX > 25 (value: 9.65)✗ +0
Volatility · 10/10
ATR vs 50d avg (stable, visual estimate)✓ +10
Note: Trend intact above both SMAs ($29.08 50-day, $25.19 250-day). Momentum bullish (MACD above signal, ROC +4.23). ADX at 9.65 shows no directional conviction — consolidating below its May/June highs. Volatility steady.
Chart
Daily Chart SMA / ADX / MACD / ROC / ATR · click to enlarge
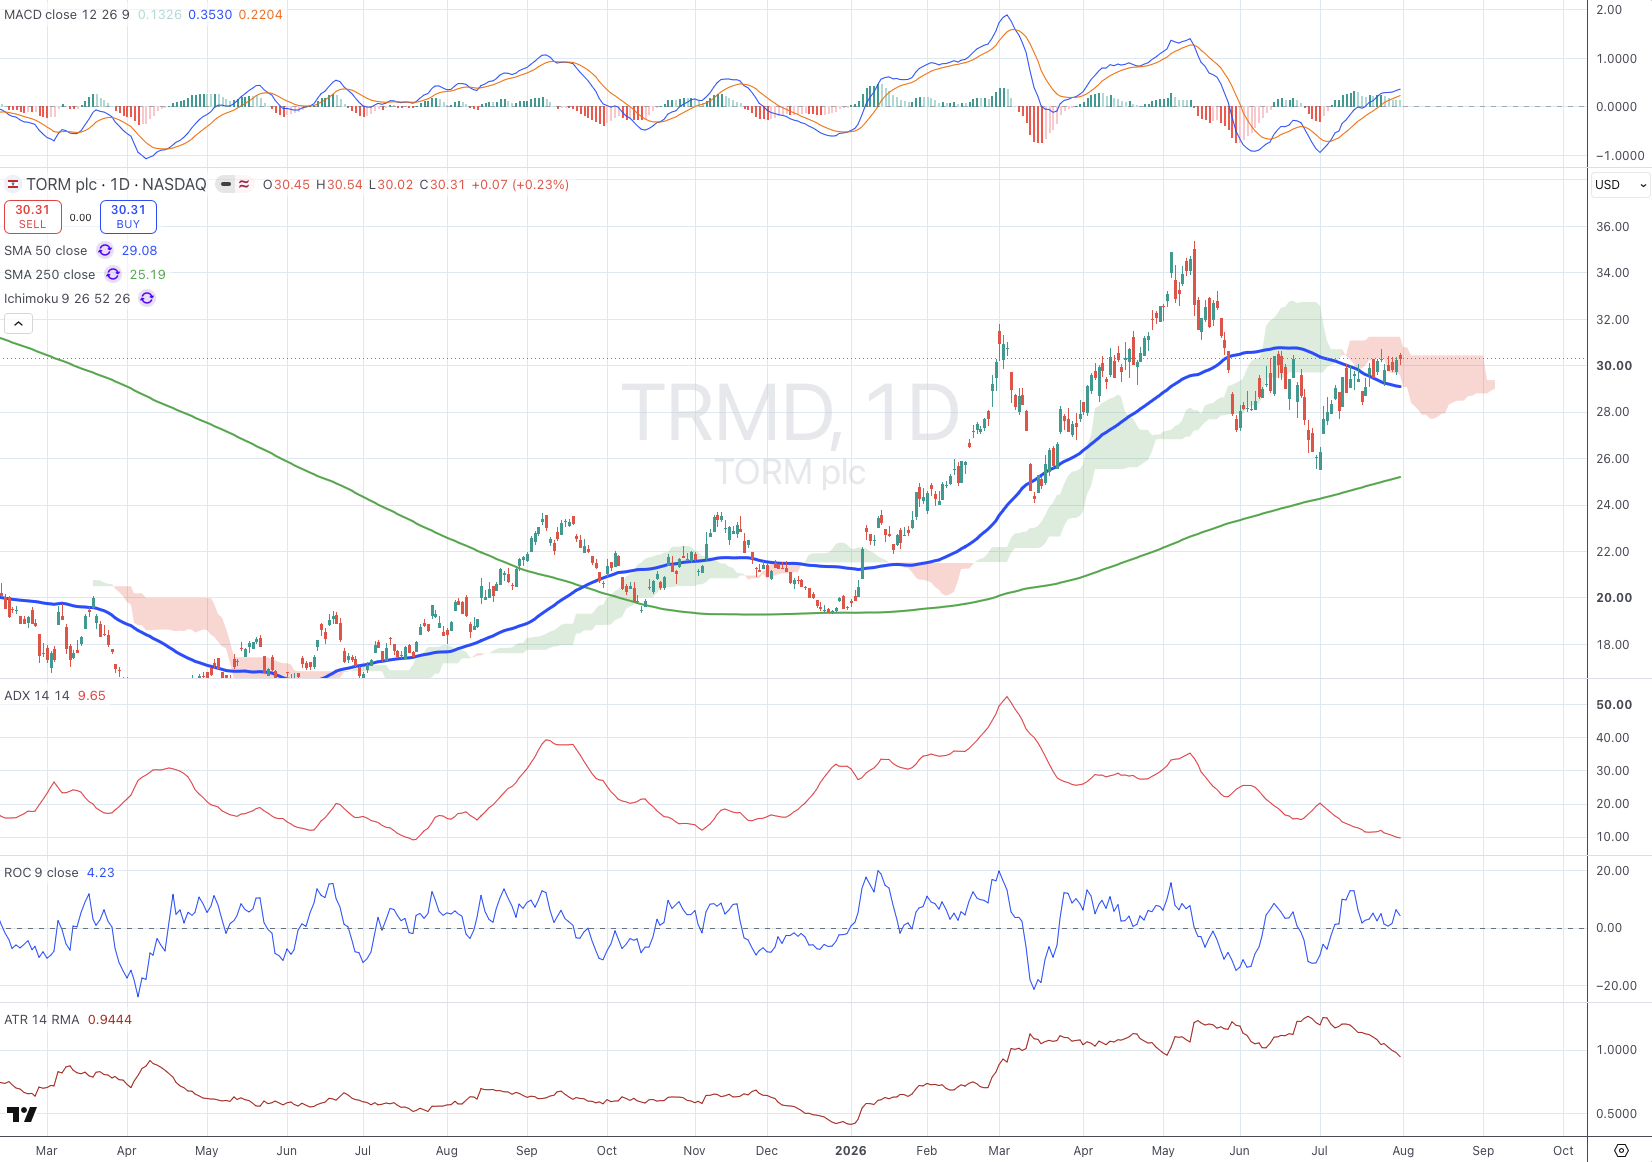
TORM's daily chart shows price holding above both the 50-day ($29.08) and 250-day ($25.19) moving averages, with MACD above signal and ROC at a modest +4.23. ADX at 9.65 is among the weakest trend-strength readings in the group, consistent with a stock that's been consolidating below its May/June highs rather than making fresh progress. Volatility stays steady, giving no early read on which way the range resolves. The setup is constructive but quiet — a move back toward the May/June highs with ADX turning up would be the signal that the stock is ready to trend again rather than drift.