Strait Intelligence · Strait Signal
Tanker · Weekly Chart Review
Teekay Corporation Ltd
NYSE: TK
Strait Signal — Technical Score
Score
80/100
Green
First entry on file — no prior week to compare.
Trend · 35/35
Price > 250 SMA✓ +20
Price > 50 SMA✓ +15
Momentum · 35/35
MACD bullish✓ +20
ROC positive✓ +15
Trend Strength · 0/20
ADX > 25 (value: 11.9)✗ +0
Volatility · 10/10
ATR vs 50d avg (stable, visual estimate)✓ +10
Note: Price has recovered back above both SMAs ($11.46 50-day, $10.45 250-day) after the July pullback — a thin margin above the 50-day (+1.7%) but real. Momentum turned bullish (MACD's histogram just flipped positive, ROC +8.27 — a strong reading off the recent low). ADX at 11.90 shows no trend-strength conviction yet.
Chart
Daily Chart SMA / ADX / MACD / ROC / ATR · click to enlarge
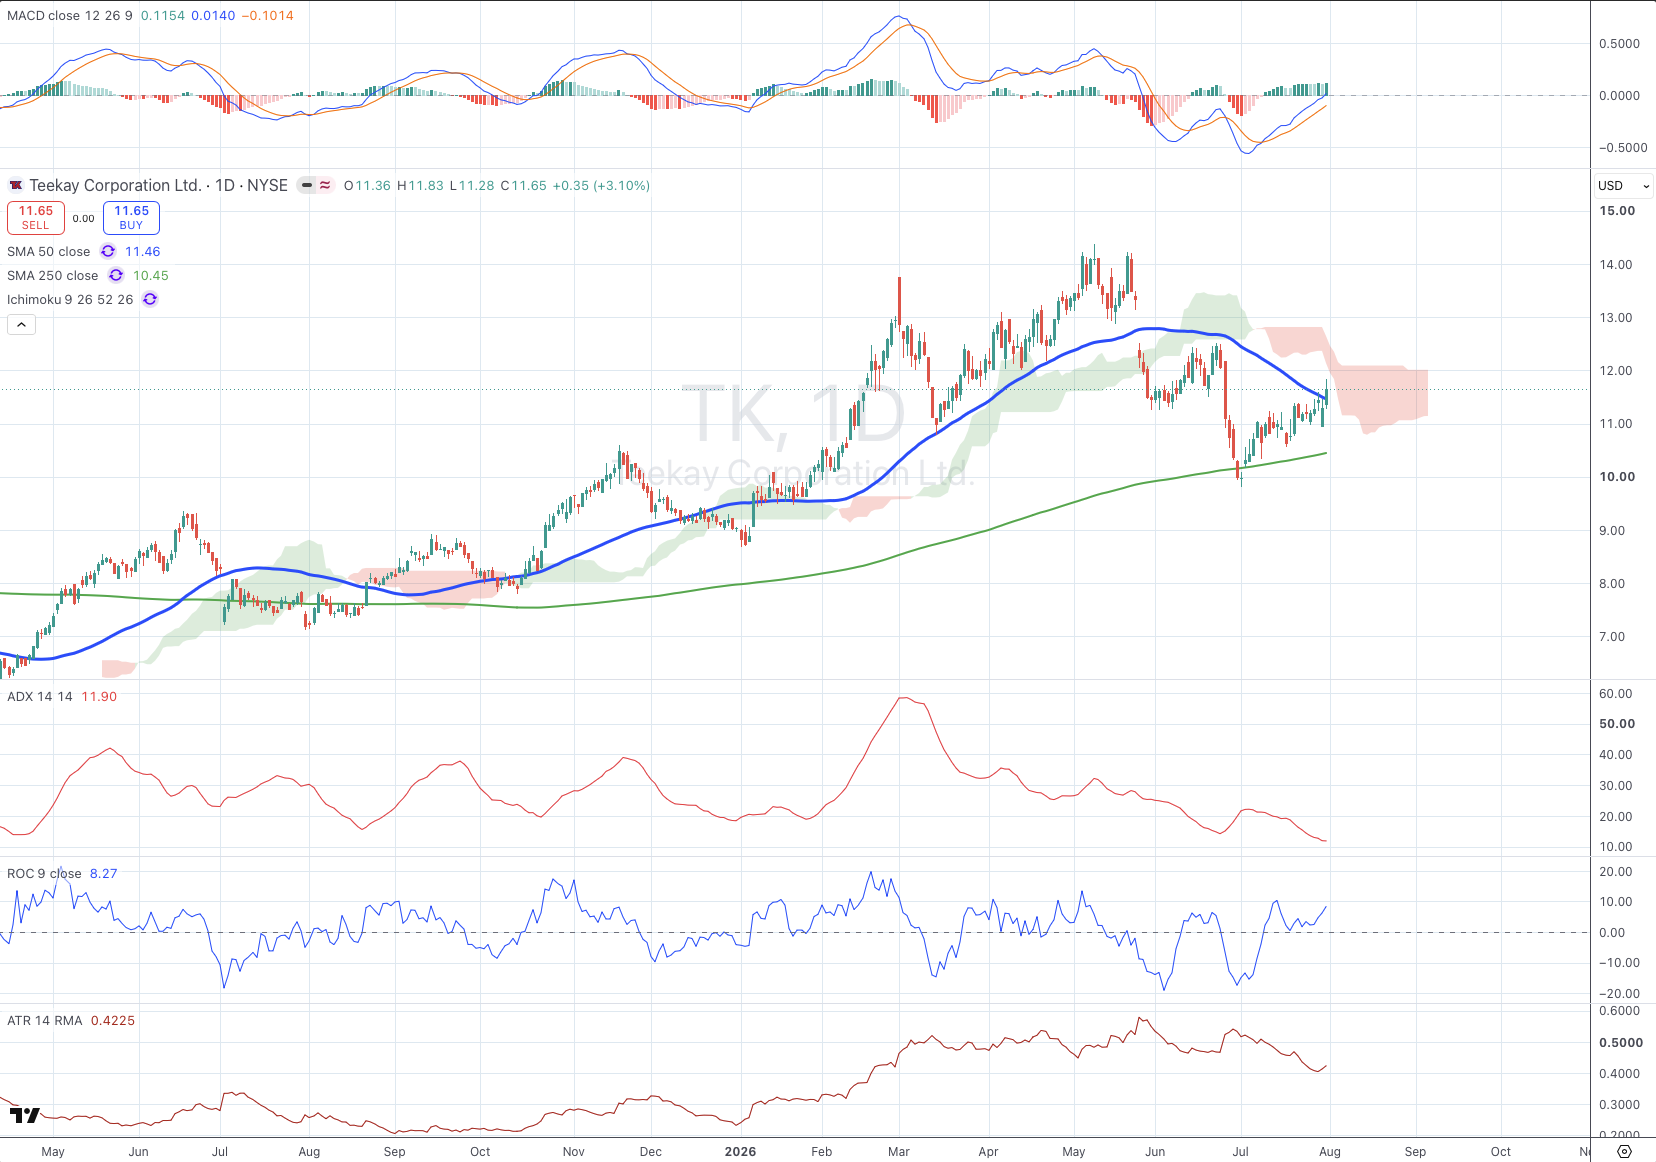
Teekay Corporation's daily chart has just clawed back above both moving averages after the July pullback, though the margin above the 50-day ($11.46) is thin — roughly 1.7% — while the 250-day ($10.45) offers more cushion underneath. Momentum has flipped constructive: the MACD histogram just turned positive and ROC is printing a strong +8.27 off the recent low, a sharp swing in tone from two weeks ago. ADX at 11.90 shows this recovery hasn't yet built real trend-strength conviction — it reads as an early-stage bounce rather than a confirmed reversal. The next test is whether price can hold above the 50-day on any pullback; a close back below it would put the recovery in doubt.