Strait Intelligence · Strait Signal
Tanker · Weekly Chart Review
International Seaways Inc
NYSE: INSW
Strait Signal — Technical Score
Score
80/100
Green
Prior entry (28 Jul 2026, provisional): 80/100 → Green. This is the first non-provisional (real) entry.
Trend · 35/35
Price > 250 SMA✓ +20
Price > 50 SMA✓ +15
Momentum · 35/35
MACD bullish✓ +20
ROC positive✓ +15
Trend Strength · 0/20
ADX > 25 (value: 17.51)✗ +0
Volatility · 10/10
ATR vs 50d avg (stable, visual estimate)✓ +10
Note: Still the strongest trend picture in the tanker complex — price well above both SMAs ($84.76 50-day, $63.60 250-day), fresh highs on the chart. Momentum bullish (MACD comfortably above signal, ROC +8.80), but ADX at 17.51 again shows no genuine directional strength. This matches the first provisional read from 28 July almost exactly — same score, same story.
Chart
Daily Chart SMA / ADX / MACD / ROC / ATR · click to enlarge
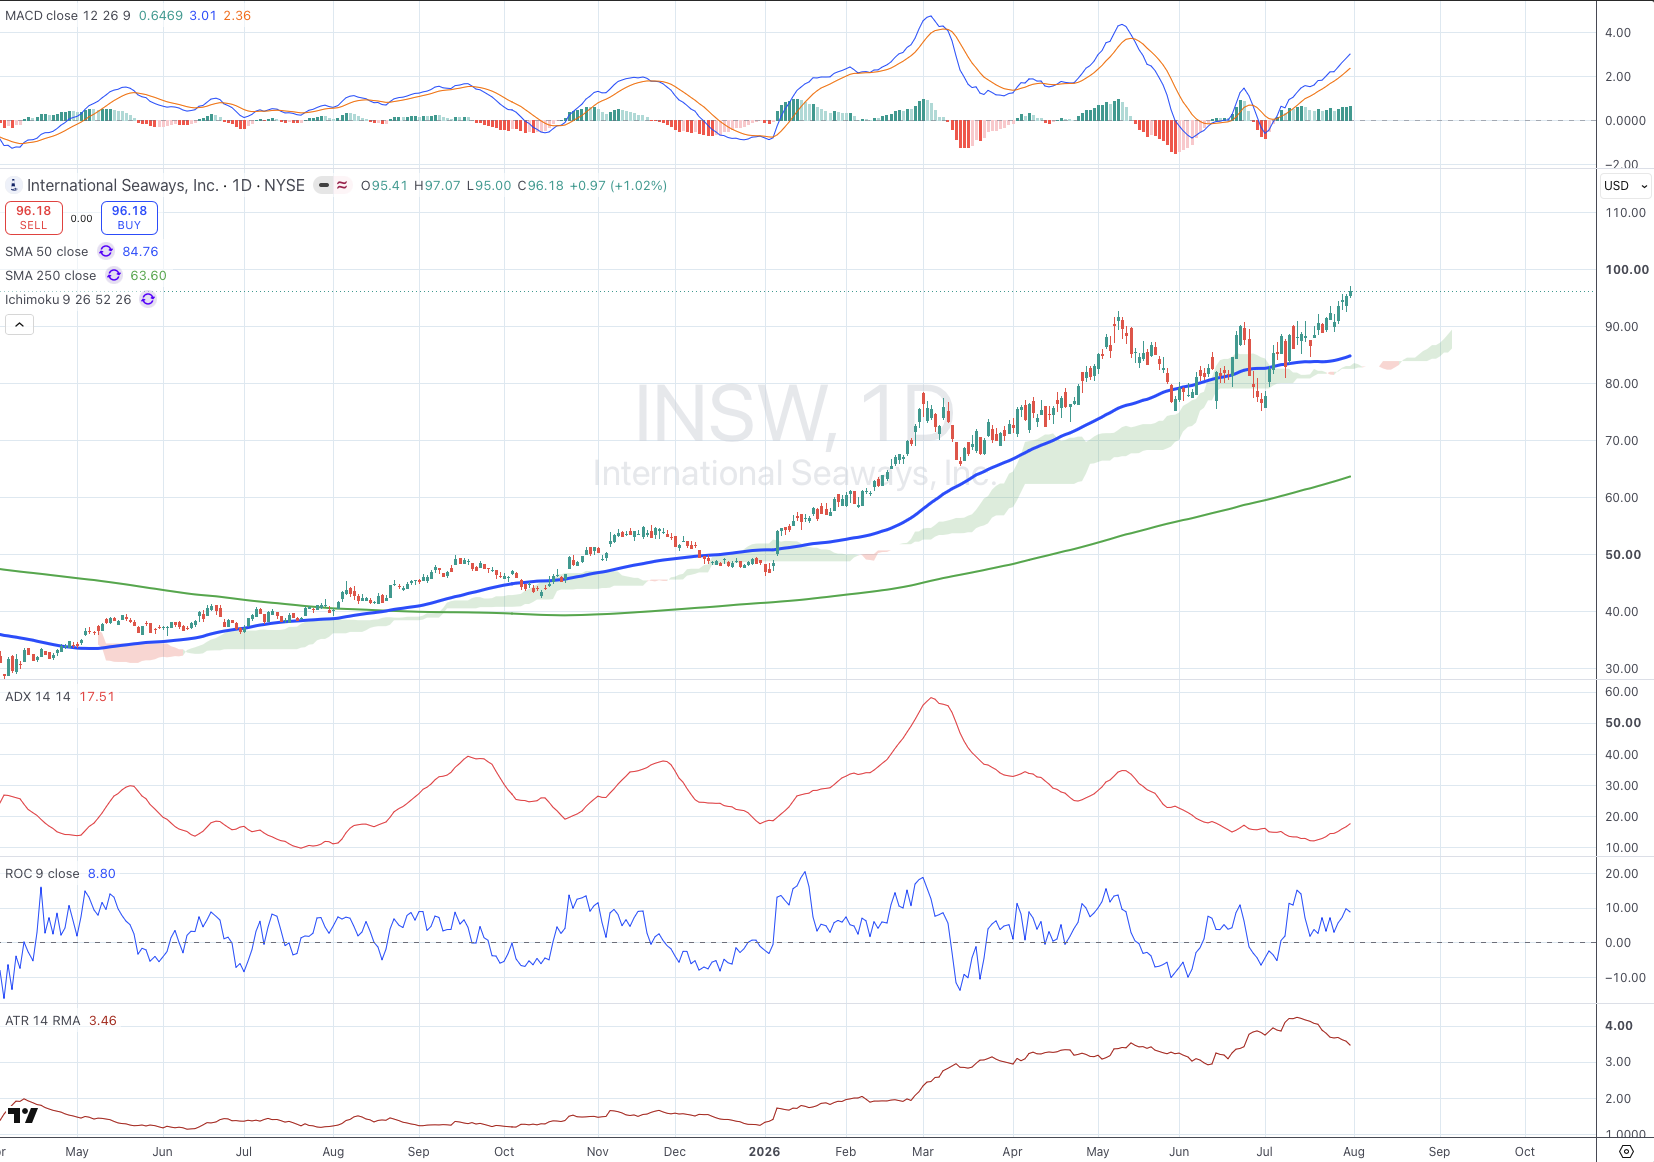
International Seaways remains the most extended chart in the tanker complex — price trades well above both its 50-day ($84.76) and 250-day ($63.60) moving averages, still the widest such gap in this batch. Momentum has strengthened further from the 28 July read, with ROC climbing to +8.80, though ADX at 17.51 — up from 14.46 a week earlier — is still short of the trend-strength threshold. This is a name that keeps grinding higher without ever registering as a classically "strong" trend on ADX terms. The 50-day SMA remains the level to watch: as long as price holds above it, this stays the strongest structure in the group.