Strait Intelligence · Strait Signal
Macro · Weekly Chart Review
U.S. Dollar Index
TVC: DXY
Strait Signal — Technical Score
Score
30/100
Red
First entry on file — no prior week to compare.
Trend · 20/35
Price > 250 SMA✓ +20
Price > 50 SMA✗ +0
Momentum · 0/35
MACD bullish✗ +0
ROC positive✗ +0
Trend Strength · 0/20
ADX > 25 (value: 24.45)✗ +0
Volatility · 10/10
ATR vs 50d avg (genuinely contracting, near its lowest level of the year)✓ +10
Note: The weak spot on the macro side. Price has slipped back below its 50-day SMA (100.490) though it's still above the 250-day SMA (98.943) — a partial trend score. Momentum is bearish (MACD below signal, ROC -1.18), and ADX at 24.45 sits just below the 25 trend-strength threshold — the closest miss in the whole batch. Volatility is genuinely contracting (ATR near its lowest level of the year), the one point still on the board.
Chart
Daily Chart SMA / ADX / MACD / ROC / ATR · click to enlarge
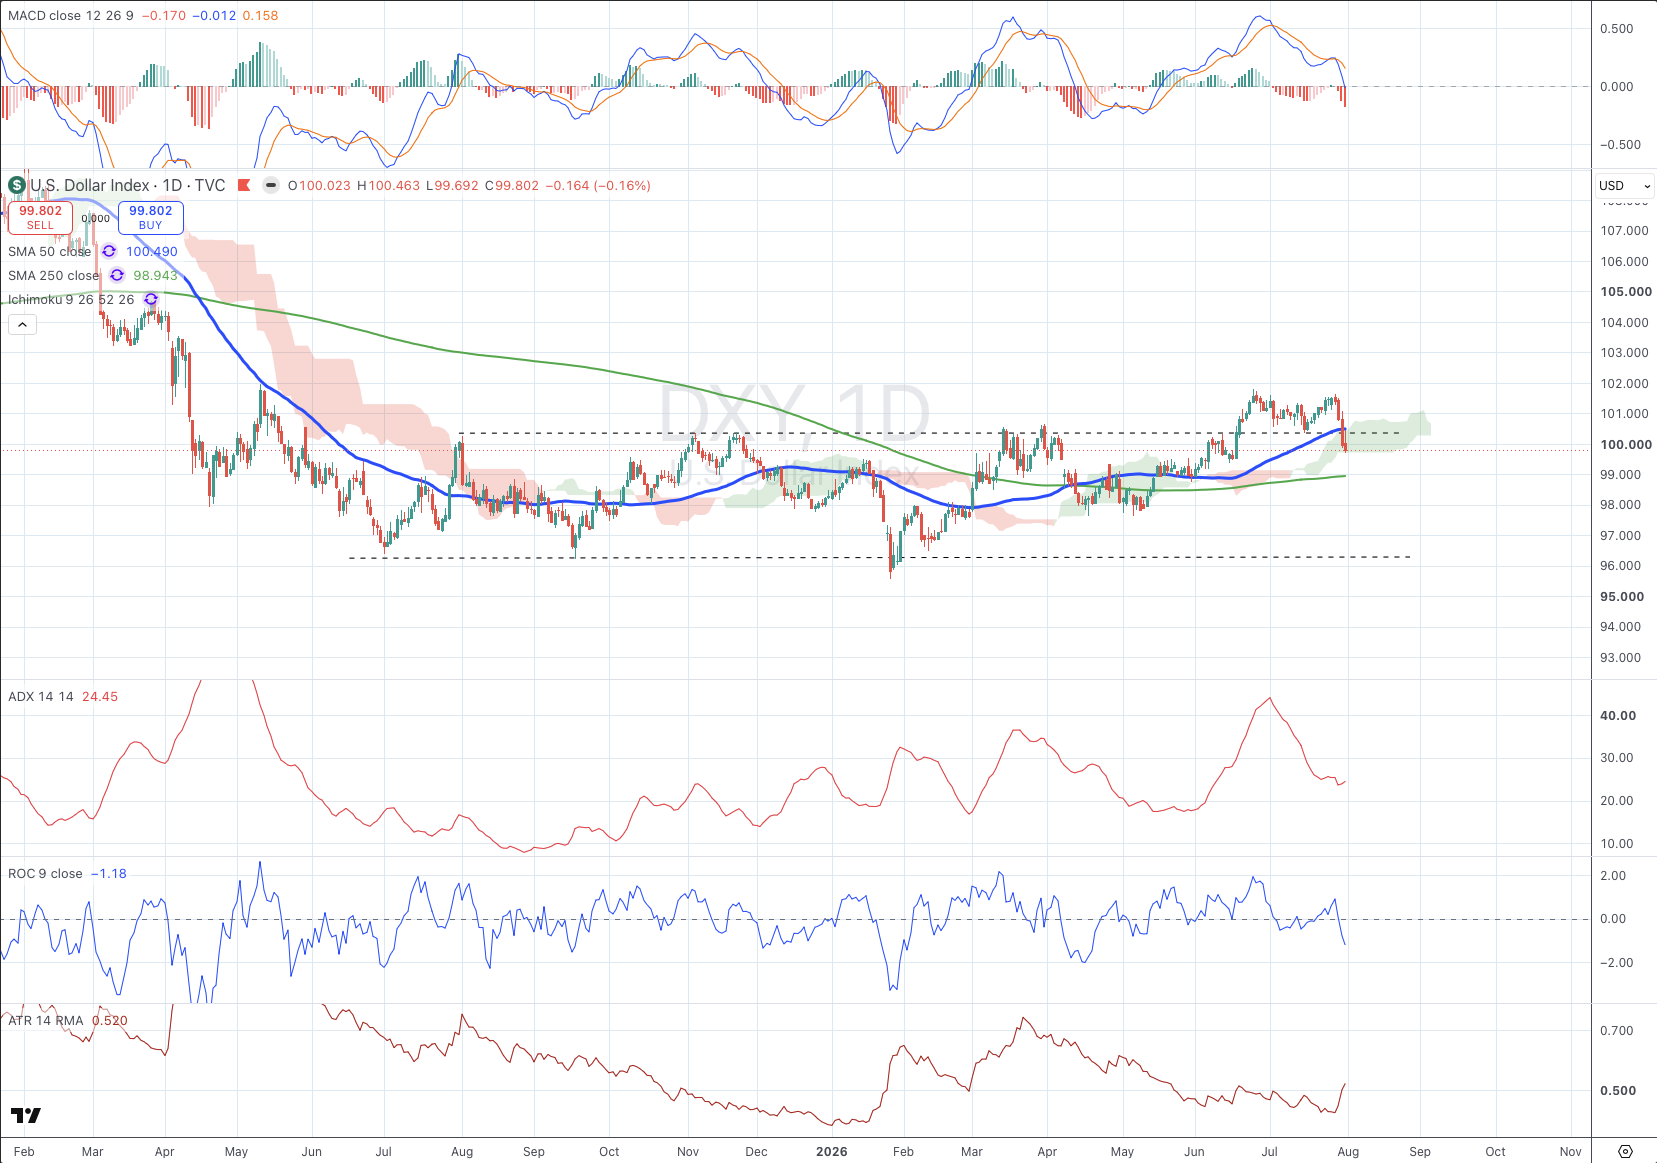
Note: the ATR-vs-50-day-average comparison isn't a value TradingView labels directly — it's read visually off the panel's recent trailing range, not calculated precisely. See the open item in OPERATIONS.md §20.10.