Strait Intelligence · Strait Signal
Tanker · Weekly Chart Review
Ardmore Shipping Corporation
NYSE: ASC
Strait Signal — Technical Score
Score
70/100
Yellow
Prior entry (29 Jul 2026): 80/100 → Green. Real decline — Green → Yellow.
Trend · 35/35
Price > 250 SMA✓ +20
Price > 50 SMA✓ +15
Momentum · 35/35
MACD bullish✓ +20
ROC positive✓ +15
Trend Strength · 0/20
ADX > 25 (value: 14.67)✗ +0
Volatility · 0/10
ATR vs 50d avg (expanding — lost the volatility point held on 29 Jul)✗ +0
Note: Trend and momentum both still intact — price above both SMAs ($16.43 50-day, $13.94 250-day), MACD above signal, ROC +9.92. But ADX at 14.67 shows no trend strength, and volatility has expanded meaningfully since the 29 July read (ATR near its high for the period) — losing the volatility points it held then. Score slips from 80/Green to 70/Yellow, a real change worth flagging even though the underlying trend/momentum picture hasn't broken.
Chart
Daily Chart SMA / ADX / MACD / ROC / ATR · click to enlarge
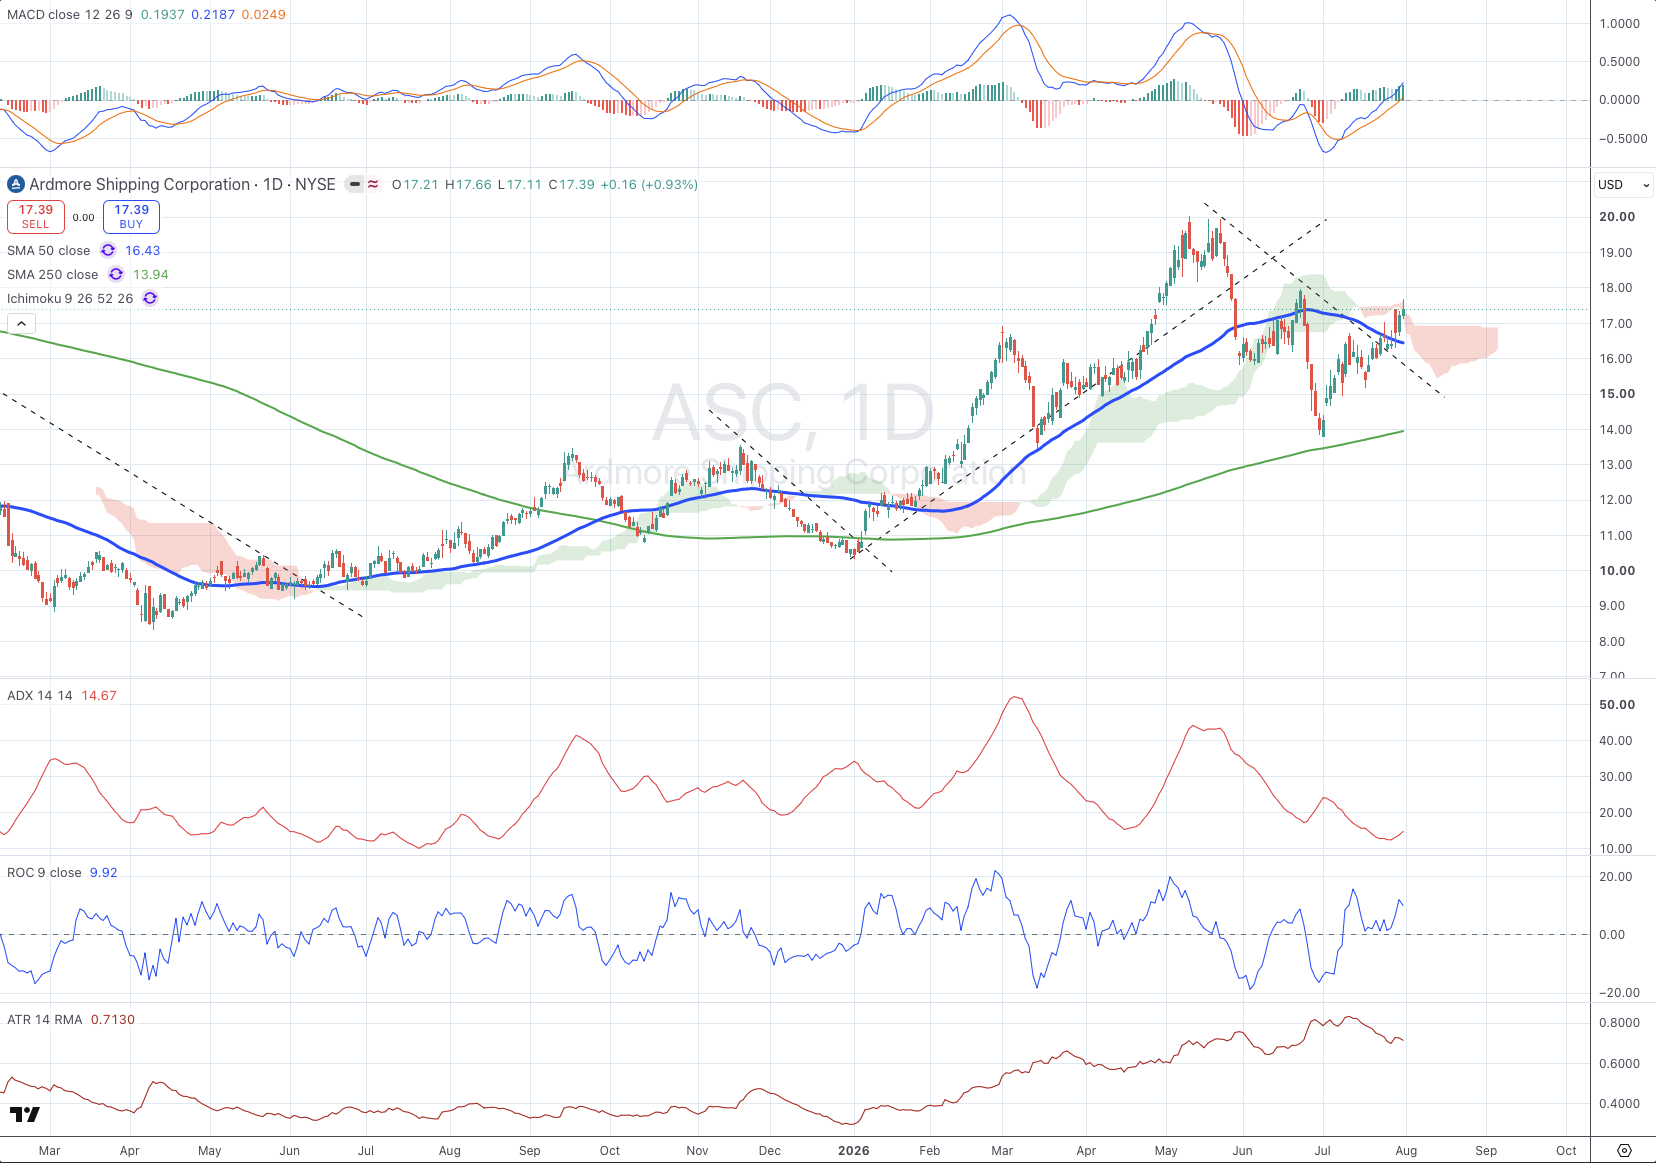
Ardmore's daily chart still shows the trend and momentum backdrop intact — price holds above both the 50-day ($16.43) and 250-day ($13.94) moving averages, MACD stays above signal, and ROC is a strong +9.92. What changed this week is volatility: ATR has expanded meaningfully off the 29 July read and now sits near its high for the period, wide enough to cost the name its Volatility points and pull the score down from 80/Green to 70/Yellow. ADX at 14.67 continues to show no genuine trend-strength behind the advance. The underlying structure hasn't broken — this is a volatility-driven score change, not a trend one — but it's worth watching whether ATR settles back down or keeps expanding.